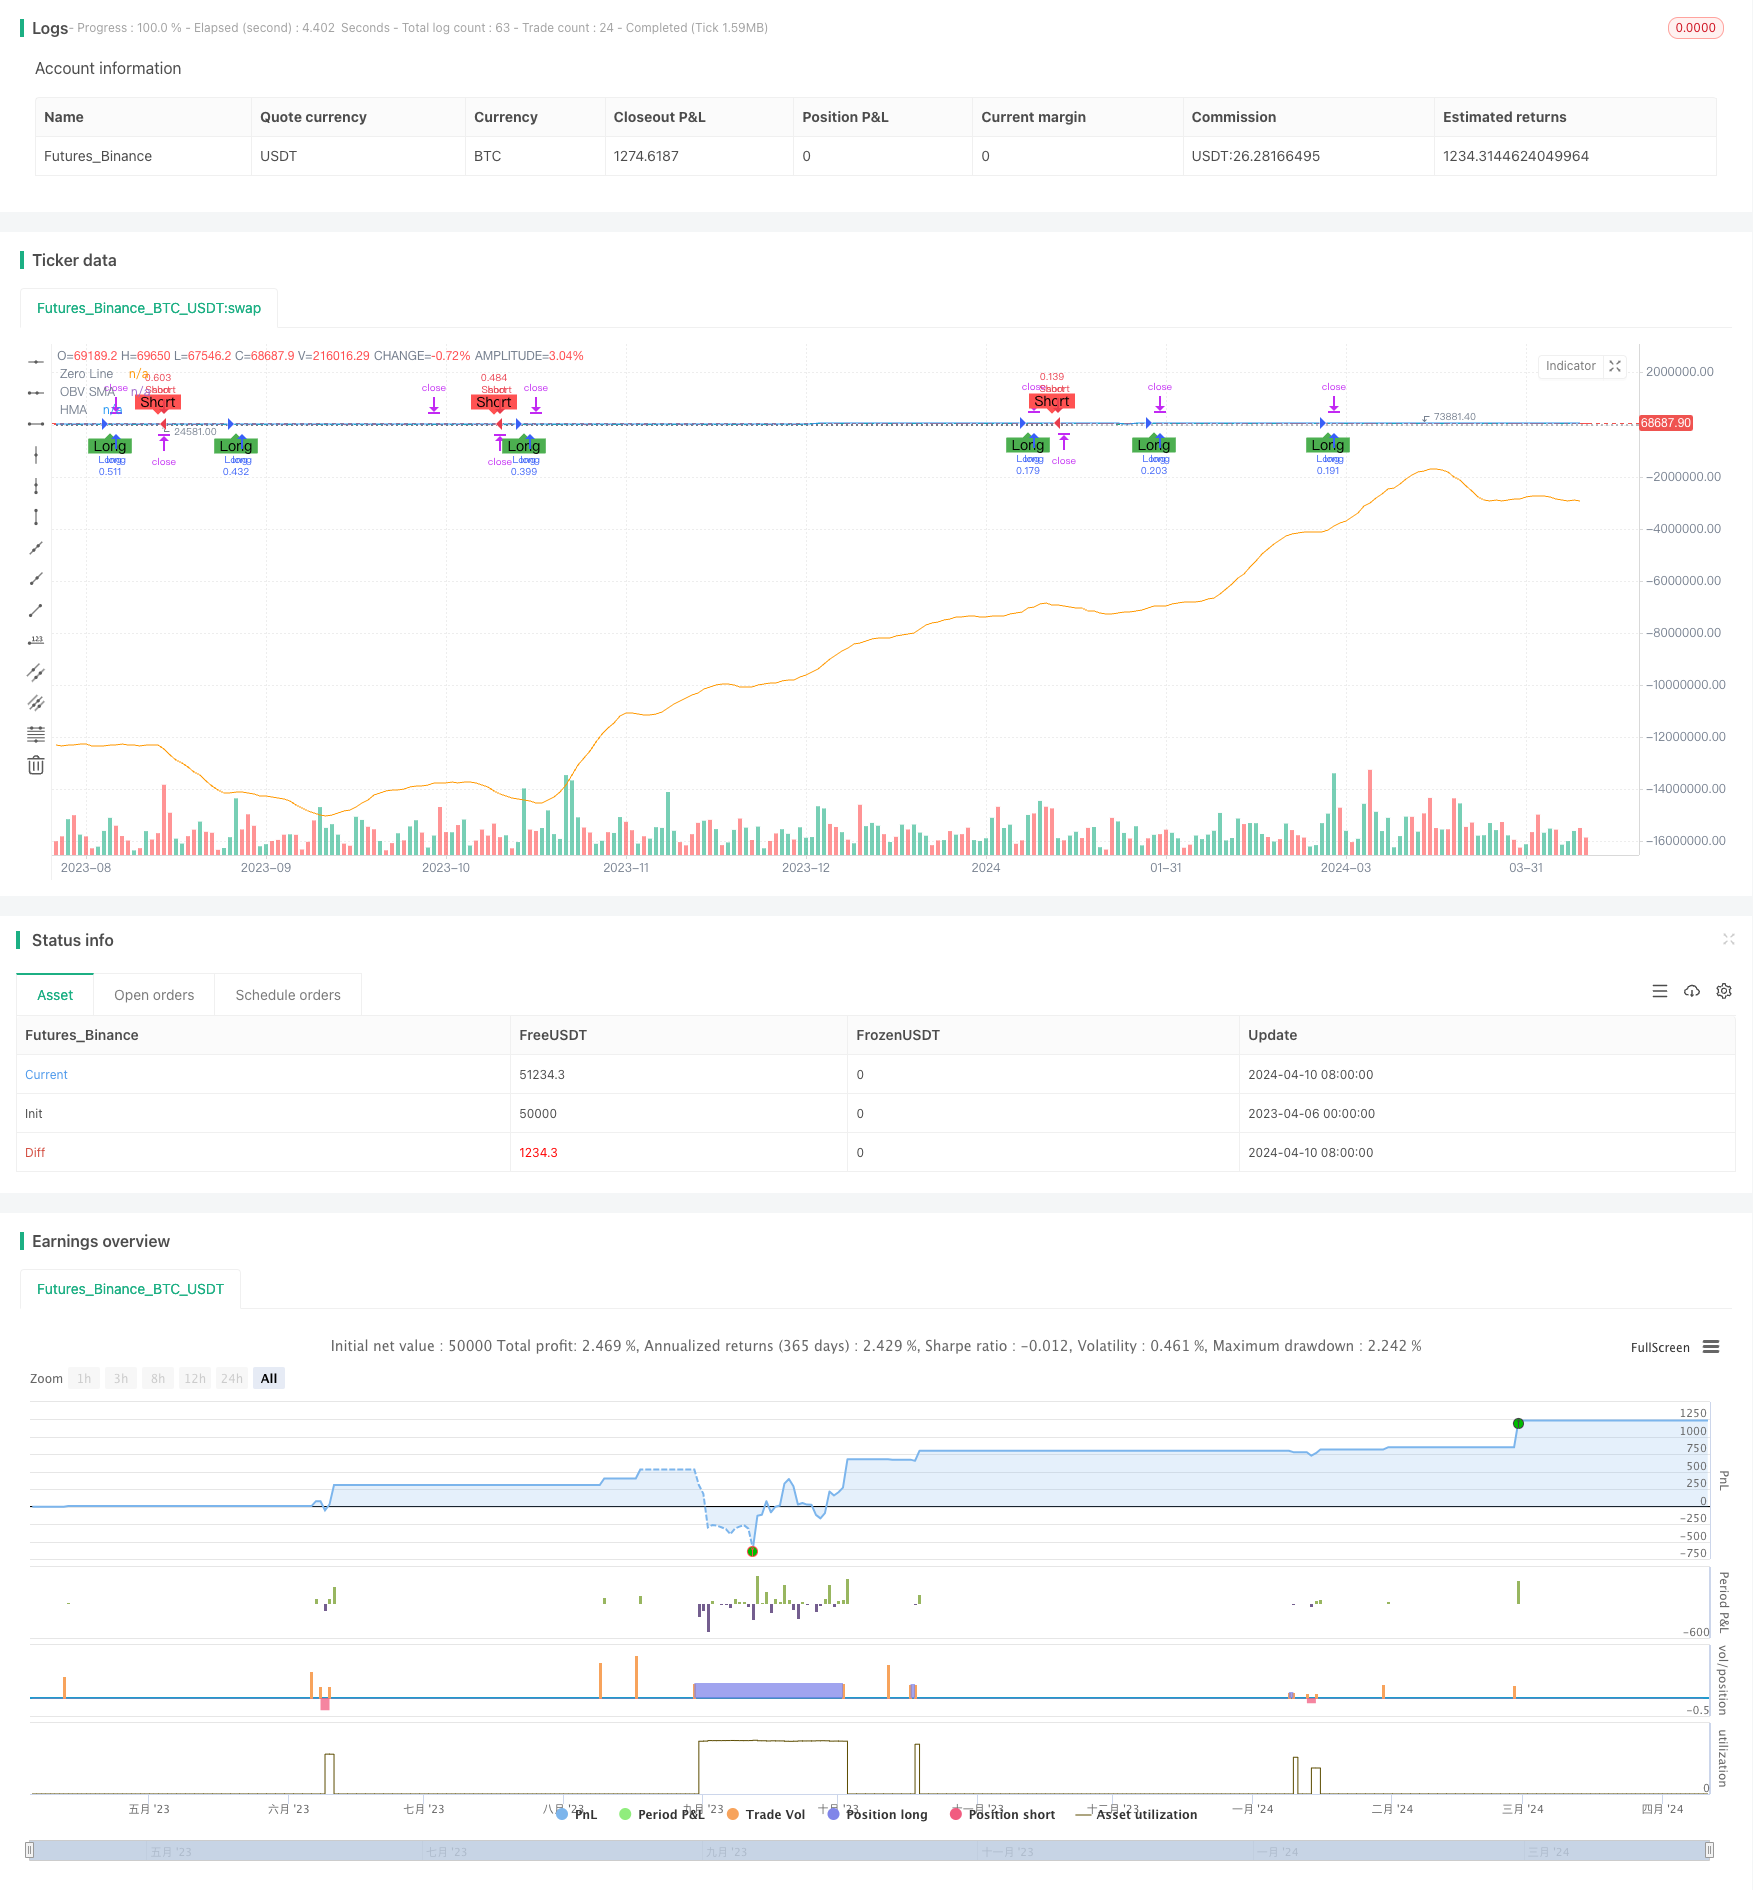
概述
该策略结合了Hull移动平均线(HMA)、移动平均线收敛发散指标(MACD)、平均真实范围(ATR)、相对强弱指数(RSI)、能量潮(OBV)和成交量移动平均线等多个技术指标,通过这些指标的综合分析,识别市场趋势和潜在的进场机会。同时,该策略还采用了金字塔加仓、动态止损止盈以及移动止损等风险管理手段,力求在把握趋势机会的同时,严格控制风险。
策略原理
- 计算HMA、MACD、ATR、RSI、OBV和成交量移动平均线等指标
- 根据MACD快慢线的交叉、OBV与其移动平均线的关系、RSI水平以及成交量与其均线的比较来判断多空条件
- 设置最大金字塔加仓次数和每次加仓比例,在趋势持续时逐步加仓
- 根据ATR动态调整止损和止盈水平,并采用移动止损策略保护利润
- 基于账户权益、风险比例和ATR计算每次开仓量,实现持仓头寸的动态控制
- 在图表上绘制止损止盈水平线,直观显示风险控制情况
策略优势
- 多指标组合判断,提高信号可靠性:该策略综合考虑了价格、趋势、动量和成交量等多方面因素,通过多个指标的共同确认,提高了交易信号的可靠性。
- 自适应仓位管理,动态控制风险:根据账户权益、风险比例和ATR等因素,策略可以动态调整每次开仓量,在市场波动加剧时自动减少仓位,从而有效控制风险。
- 金字塔加仓,充分把握趋势机会:在趋势确立后,策略通过逐步加仓的方式,最大程度地参与趋势行情,提高了策略的盈利能力。
- 动态止损止盈,及时控制损失和保护利润:策略根据ATR的变化实时调整止损止盈水平,在趋势反转时及时止损,同时通过移动止损策略不断保护已获得的利润,有效降低了策略的回撤。
- 直观的图表显示,便于监控和决策:策略在图表上绘制了关键指标和止损止盈水平线,使得交易者可以直观地监控市场走势和策略执行情况,为及时调整策略提供依据。
策略风险
- 参数优化风险:该策略包含多个参数,如果参数选择不当,可能导致策略表现不佳。因此,在实际应用中,需要对参数进行优化和测试,以确保策略的稳健性。
- 市场环境变化风险:策略基于历史数据进行回测和优化,但市场环境可能发生变化,导致策略在未来表现与历史表现差异较大。因此,需要定期评估策略表现,必要时进行调整。
- 黑天鹅事件风险:极端市场行情(如暴涨暴跌)可能会导致策略出现较大回撤。为应对这种风险,可以考虑在策略中加入更多的风险控制措施,如设置最大回撤阈值,一旦达到阈值就停止交易。
- 过拟合风险:如果策略参数过于复杂,可能出现过拟合现象,即策略在历史数据上表现良好,但在实际应用中表现不佳。为避免过拟合,可以采用交叉验证等方法对策略进行评估。
策略优化方向
- 动态参数优化:考虑使用机器学习等方法,根据市场环境的变化实时调整策略参数,提高策略的适应性。
- 多市场多品种适用性:将策略扩展到更多市场和品种,通过分散投资提高策略的稳健性。
- 结合基本面分析:在技术分析的基础上,加入对宏观经济、行业趋势等基本面因素的考量,提高策略的全面性。
- 加入市场情绪分析:引入市场情绪指标,如恐慌指数等,捕捉市场情绪的极端变化,为策略提供更多的交易机会。
- 优化风险控制措施:进一步完善风险控制体系,如引入止损策略的自适应调整机制,提高策略的风险管理能力。
总结
该策略通过多指标组合、自适应仓位管理、金字塔加仓、动态止损止盈等方法,在把握趋势机会的同时严格控制风险,具有一定的稳健性和盈利能力。但策略也存在参数优化、市场环境变化、黑天鹅事件等风险,需要在实际应用中不断优化和完善。未来可以考虑从动态参数优化、多市场扩展、基本面结合、市场情绪分析和风险控制优化等方面对策略进行改进,以提高策略的适应性和稳健性。
策略源码
/*backtest
start: 2023-04-06 00:00:00
end: 2024-04-11 00:00:00
period: 1d
basePeriod: 1h
exchanges: [{"eid":"Futures_Binance","currency":"BTC_USDT"}]
*/

//@version=4
strategy("Enhanced Trading Strategy v5 with Visible SL/TP", overlay=true)

// Input settings
hma_length = input(9, title="HMA Length")
fast_length = input(12, title="MACD Fast Length")
slow_length = input(26, title="MACD Slow Length")
siglen = input(9, title="Signal Smoothing")
atr_length = input(14, title="ATR Length")
rsi_length = input(14, title="RSI Length")
obv_length = input(10, title="OBV Length")
volume_ma_length = input(10, title="Volume MA Length")

// Pyramiding inputs
max_pyramid_positions = input(3, title="Max Pyramid Positions")
pyramid_factor = input(0.5, title="Pyramid Factor")

// Risk and Reward Management Inputs
risk_per_trade = input(1.0, title="Risk per Trade (%)")
atr_multiplier_for_sl = input(1.5, title="ATR Multiplier for Stop Loss")
atr_multiplier_for_tp = input(3.0, title="ATR Multiplier for Take Profit")
trailing_atr_multiplier = input(2.0, title="ATR Multiplier for Trailing Stop")

// Position sizing functions
calc_position_size(equity, risk_pct, atr) =>
    pos_size = (equity * risk_pct / 100) / (atr_multiplier_for_sl * atr)
    pos_size

calc_pyramid_size(current_size, max_positions) =>
    pyramid_size = current_size * (max_positions - strategy.opentrades) / max_positions
    pyramid_size

// Pre-calculate lengths for HMA
half_length = ceil(hma_length / 2)
sqrt_length = round(sqrt(hma_length))

// Calculate indicators
hma = wma(2 * wma(close, half_length) - wma(close, hma_length), sqrt_length)
my_obv = cum(close > close[1] ? volume : close < close[1] ? -volume : 0)
obv_sma = sma(my_obv, obv_length)
[macd_line, signal_line, _] = macd(close, fast_length, slow_length, siglen)
atr = atr(atr_length)
rsi = rsi(close, rsi_length)
vol_ma = sma(volume, volume_ma_length)

// Conditions
long_condition = crossover(macd_line, signal_line) and my_obv > obv_sma and rsi > 50 and volume > vol_ma
short_condition = crossunder(macd_line, signal_line) and my_obv < obv_sma and rsi < 50 and volume > vol_ma

// Strategy Entry with improved risk-reward ratio
var float long_take_profit = na
var float long_stop_loss = na
var float short_take_profit = na
var float short_stop_loss = na

if (long_condition)
    size = calc_position_size(strategy.equity, risk_per_trade, atr)
    strategy.entry("Long", strategy.long, qty = size)
    long_stop_loss := close - atr_multiplier_for_sl * atr
    long_take_profit := close + atr_multiplier_for_tp * atr

if (short_condition)
    size = calc_position_size(strategy.equity, risk_per_trade, atr)
    strategy.entry("Short", strategy.short, qty = size)
    short_stop_loss := close + atr_multiplier_for_sl * atr
    short_take_profit := close - atr_multiplier_for_tp * atr

// Drawing the SL/TP lines
// if (not na(long_take_profit))
//     line.new(bar_index[1], long_take_profit, bar_index, long_take_profit, width = 2, color = color.green)
//     line.new(bar_index[1], long_stop_loss, bar_index, long_stop_loss, width = 2, color = color.red)

// if (not na(short_take_profit))
//     line.new(bar_index[1], short_take_profit, bar_index, short_take_profit, width = 2, color = color.green)
//     line.new(bar_index[1], short_stop_loss, bar_index, short_stop_loss, width = 2, color = color.red)

// Pyramiding logic
if (strategy.position_size > 0)
    if (close > strategy.position_avg_price * (1 + pyramid_factor))
        strategy.entry("Long Add", strategy.long, qty = calc_pyramid_size(strategy.position_size, max_pyramid_positions))

if (strategy.position_size < 0)
    if (close < strategy.position_avg_price * (1 - pyramid_factor))
        strategy.entry("Short Add", strategy.short, qty = calc_pyramid_size(-strategy.position_size, max_pyramid_positions))

// Trailing Stop
strategy.exit("Trailing Stop Long", "Long", trail_points = atr * trailing_atr_multiplier, trail_offset = atr * trailing_atr_multiplier)
strategy.exit("Trailing Stop Short", "Short", trail_points = atr * trailing_atr_multiplier, trail_offset = atr * trailing_atr_multiplier)

// Plots
plot(hma, title="HMA", color=color.blue)
plot(obv_sma, title="OBV SMA", color=color.orange)
hline(0, "Zero Line", color=color.gray, linestyle=hline.style_dotted)
plotshape(long_condition, title="Long Entry", location=location.belowbar, color=color.green, style=shape.labelup, text="Long")
plotshape(short_condition, title="Short Entry", location=location.abovebar, color=color.red, style=shape.labeldown, text="Short")
相关推荐