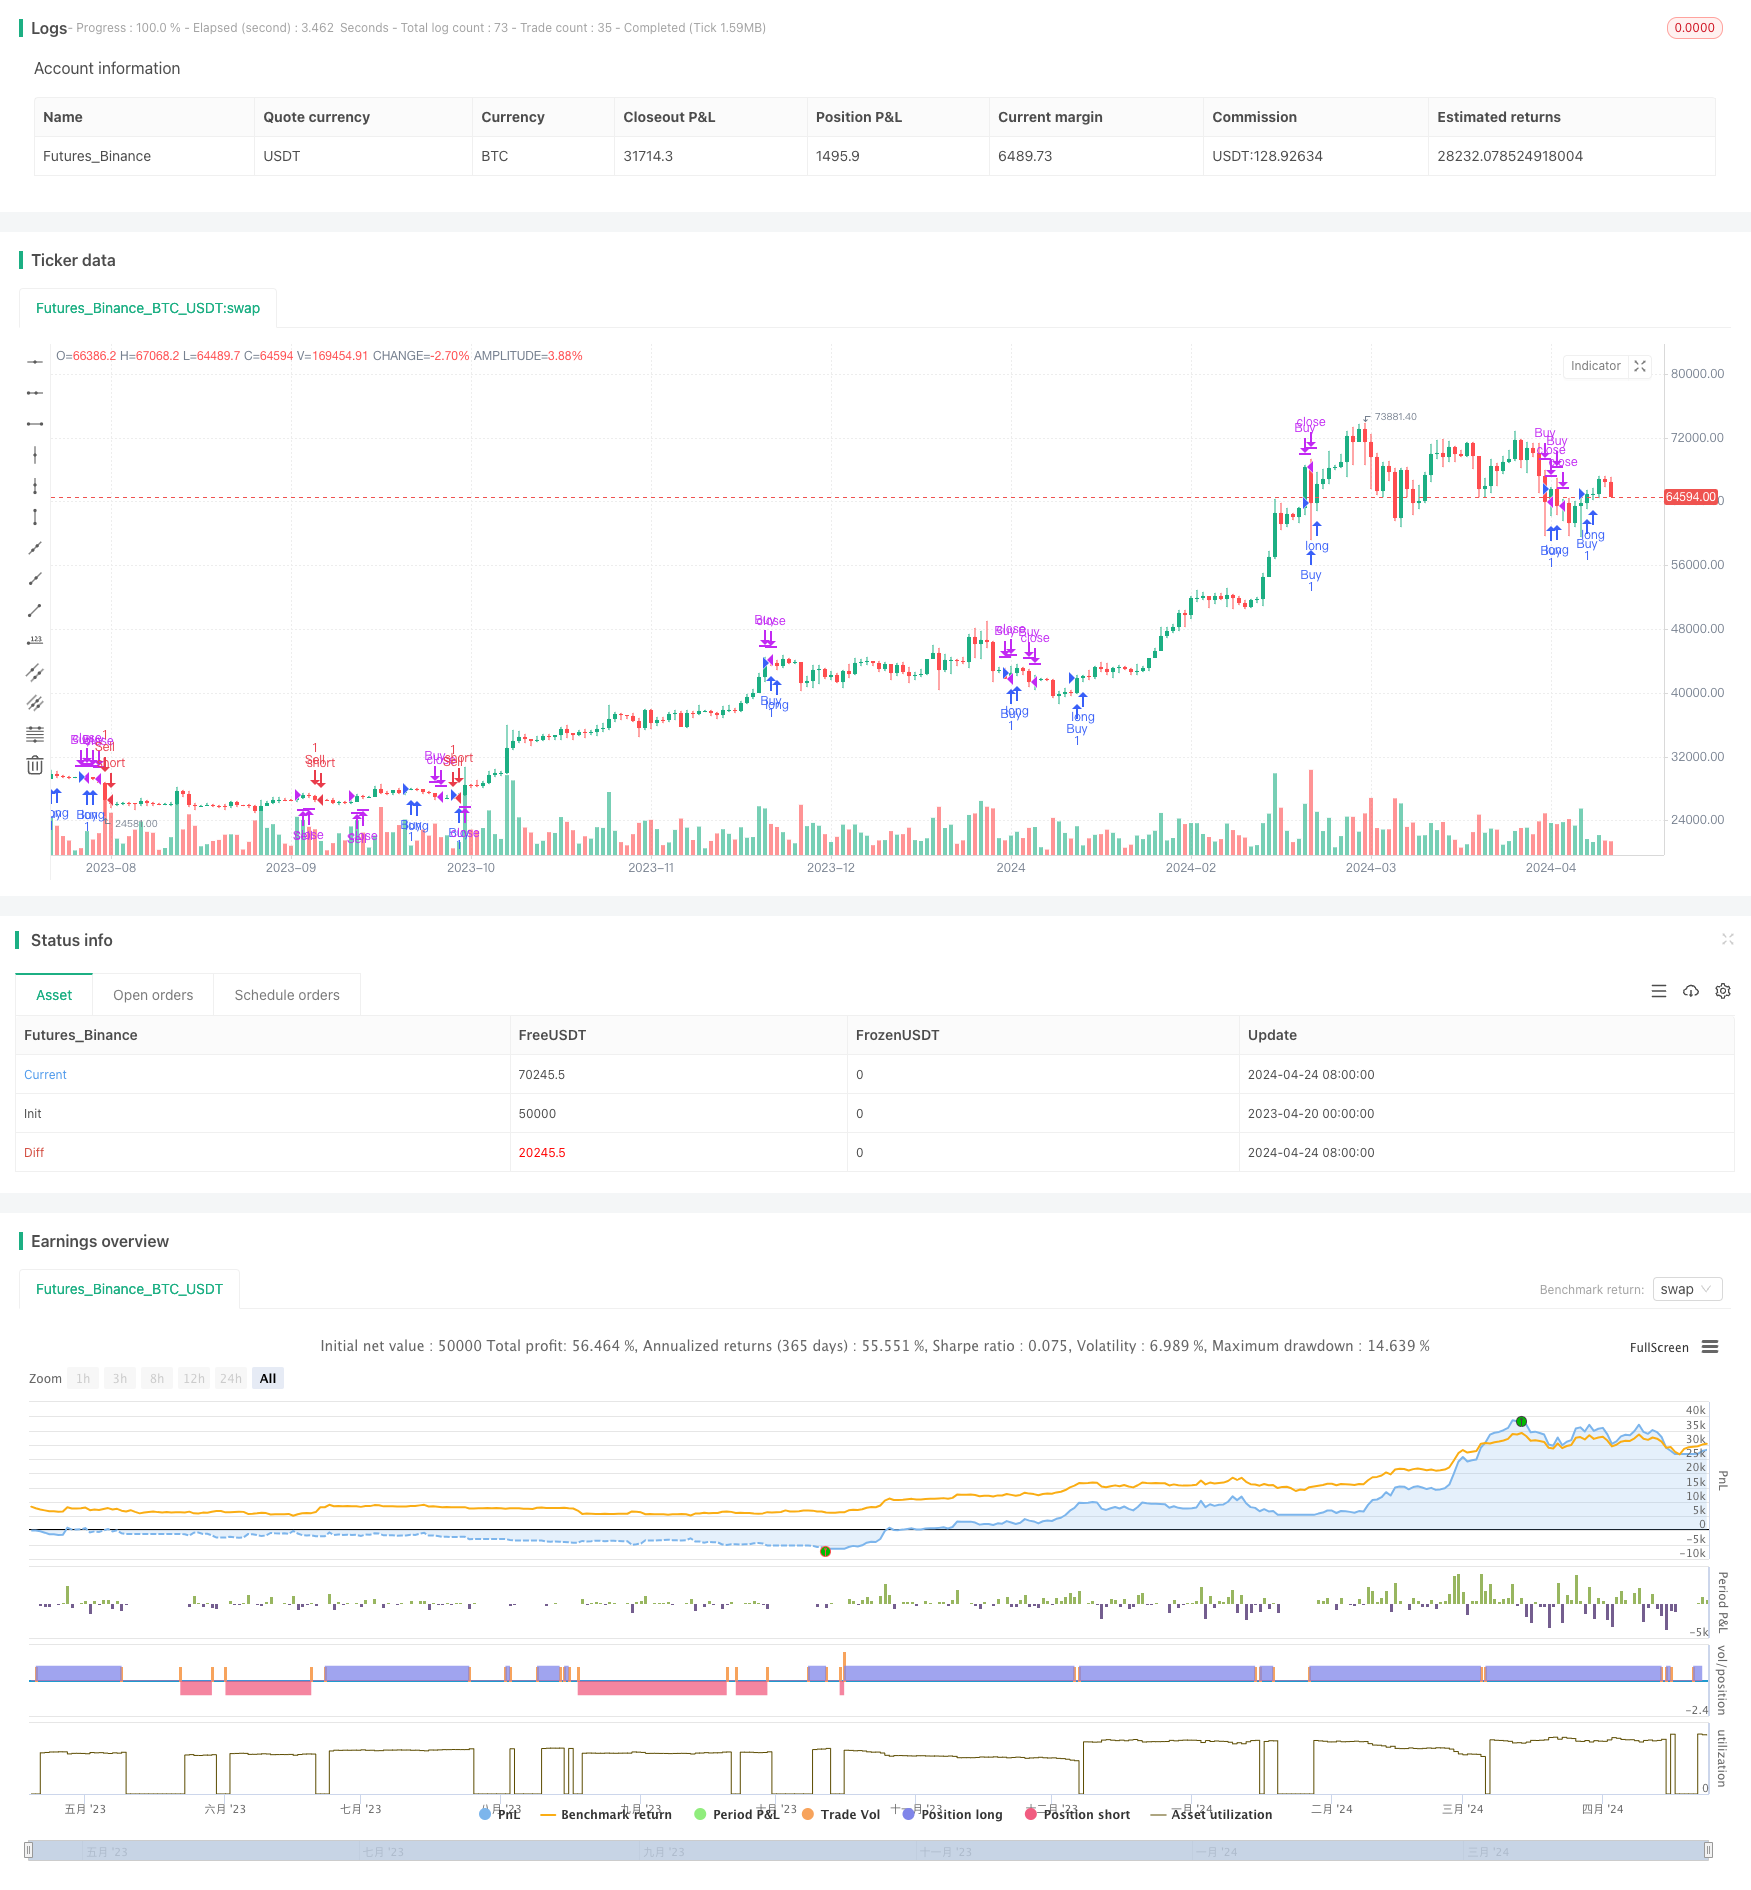
概述
该策略基于EMA23和EMA50的交叉信号进行交易。当EMA23上穿EMA50时产生买入信号,下穿时产生卖出信号。该策略还会在价格跌破EMA50时对多头头寸进行止损,反之对空头头寸进行止损。此外,该策略还会在价格重新站上EMA50时重新进场。该策略适用于30分钟的时间框架。
策略原理
- 计算EMA23和EMA50两条指数移动平均线。
- 当EMA23上穿EMA50时,产生买入信号;当EMA23下穿EMA50时,产生卖出信号。
- 对于多头头寸,如果价格跌破EMA50并且收盘价低于前一根K线的EMA50,则进行止损。
- 对于空头头寸,如果价格上破EMA50并且收盘价高于前一根K线的EMA50,则进行止损。
- 对于多头头寸,如果价格重新站上EMA50并且收盘价、最高价均高于EMA50,且EMA23高于EMA50,则重新进场。
- 对于空头头寸,如果价格重新跌破EMA50并且收盘价、最低价均低于EMA50,且EMA23低于EMA50,则重新进场。
- 多头头寸的获利了结点设置为开仓价的1.6倍,空头头寸的获利了结点设置为开仓价的0.75倍。
策略优势
- 双均线交叉是一个简单而有效的趋势跟踪指标,能够帮助捕捉趋势。
- 止损机制有助于控制风险,避免损失扩大。
- 重新进场机制让策略能够再次捕捉趋势,提高盈利潜力。
- 获利了结点的设置让策略能够及时锁定利润。
- 30分钟的时间框架提供了更多的交易机会,同时也过滤了一些噪音。
策略风险
- EMA作为趋势跟踪指标有滞后性,可能错过最佳进场点。
- 止损点位置的设置可能不够优化,导致过早止损。
- 频繁交易可能导致手续费成本增加,影响盈利能力。
- 策略在震荡市可能会出现较多的虚假信号。
- 固定的获利了结点可能限制了策略的盈利空间。
策略优化方向
- 可以考虑引入其他技术指标来辅助判断趋势和改进进出场点,如MACD、RSI等。
- 对止损点的设置进行优化,可以考虑使用ATR等波动率指标来动态调整止损位置。
- 对交易频率进行控制,设置适当的交易筛选条件,减少虚假信号。
- 对震荡市和趋势市使用不同的策略参数设置。
- 获利了结点可以更加灵活,如根据市场波动率、风险回报比等动态调整。
总结
该策略是一个基于双均线交叉的量化交易策略,通过EMA23和EMA50的交叉信号来捕捉趋势,并设置了止损和重新进场机制来控制风险和提高盈利潜力。该策略简单易懂,适合30分钟等中短期交易。但是该策略也存在一些局限性,如趋势判断滞后、止损优化不足、震荡市表现欠佳等。未来可以从引入更多技术指标、优化止损位置、控制交易频率、区分趋势和震荡、动态获利了结等方面对策略进行优化,以期获得更稳健的收益。
策略源码
/*backtest
start: 2023-04-20 00:00:00
end: 2024-04-25 00:00:00
period: 1d
basePeriod: 1h
exchanges: [{"eid":"Futures_Binance","currency":"BTC_USDT"}]
*/

//@version=5
strategy("EMA Crossover Strategy", overlay=true)

// EMA 23 ve EMA 50'nin hesaplanması
ema23 = ta.ema(close, 23)
ema50 = ta.ema(close, 50)

// Ana alım kuralı: EMA 23 ve EMA 50'nin yukarı kesilmesi
buySignal = ta.crossover(ema23, ema50)

// Ana satış kuralı: EMA 23 ve EMA 50'nin aşağı kesilmesi
sellSignal = ta.crossunder(ema23, ema50)

// Long pozisyon stop seviyesi
longStopLoss = low < ema50 and close < ema50[1]

// Short pozisyon stop seviyesi
shortStopLoss = high > ema50 and close > ema50[1]

// Long pozisyon için tekrar giriş kuralı
longReEntry = high > ema50 and close > ema50 and close > ema50 and ema23 > ema50

// Short pozisyon için tekrar giriş kuralı
shortReEntry = low < ema50 and close < ema50 and close < ema50 and ema23 < ema50

// Long işlemde kar alma seviyesi (%60)
longTakeProfit = strategy.position_avg_price * 1.60

// Short işlemde kar alma seviyesi (%25)
shortTakeProfit = strategy.position_avg_price * 0.75

// Long işlem için yeniden giriş koşulu
longReEntryCondition = strategy.position_size <= 0 and longReEntry

// Short işlem için yeniden giriş koşulu
shortReEntryCondition = strategy.position_size >= 0 and shortReEntry

// Geriye dönük test için başlangıç tarihi (01.01.2022)
startDate = timestamp(2022, 01, 01, 00, 00)

if (time >= startDate)
    if (buySignal)
        strategy.entry("Buy", strategy.long)

    if (sellSignal)
        strategy.entry("Sell", strategy.short)

    if (strategy.position_size > 0 and (longStopLoss or close >= longTakeProfit))
        strategy.close("Buy")

    if (strategy.position_size < 0 and (shortStopLoss or close <= shortTakeProfit))
        strategy.close("Sell")

    if (longReEntryCondition)
        strategy.entry("Buy", strategy.long)

    if (shortReEntryCondition)
        strategy.entry("Sell", strategy.short)
相关推荐