Stochastic Crossover Indicator Momentum Trading Strategy

Overview
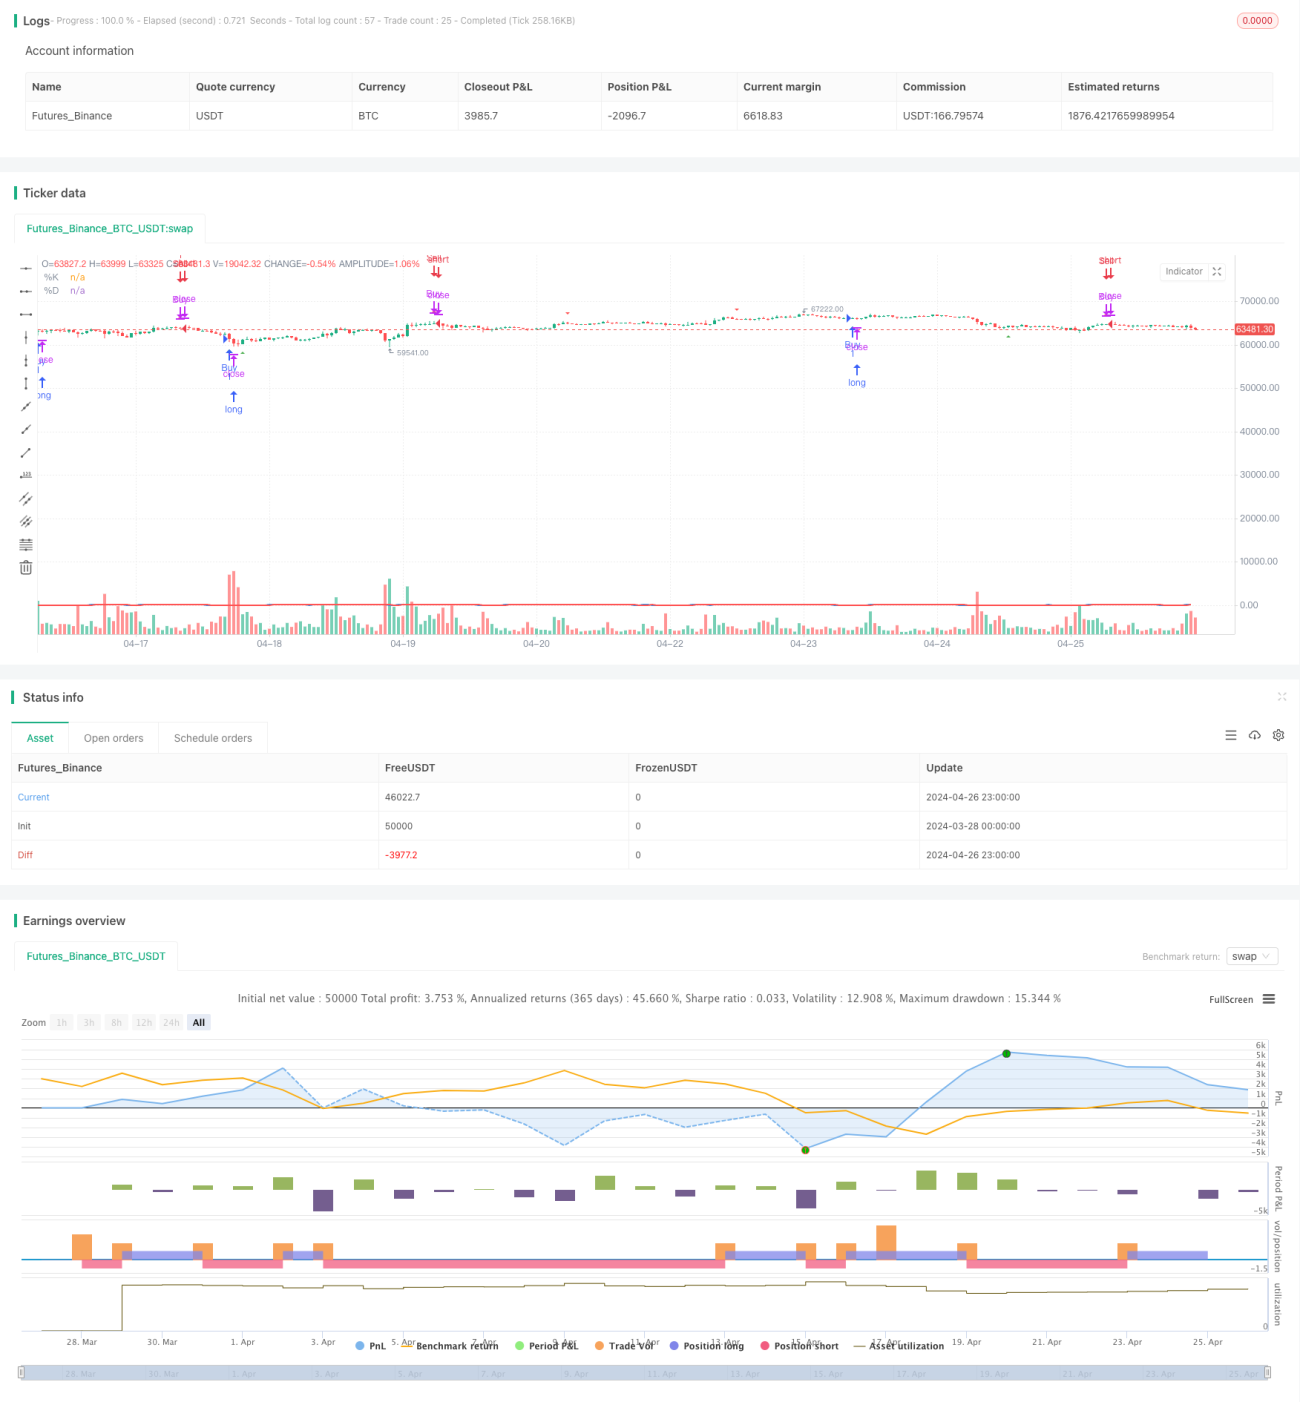
This strategy uses the crossover signals of the Stochastic Oscillator to identify potential buying and selling opportunities. When the %K line of the Stochastic Oscillator crosses above the %D line and the %K value is below 20, the strategy generates a buy signal. Conversely, when the %K line crosses below the %D line and the %K value is above 80, the strategy generates a sell signal. The strategy is applied to a 5-minute time frame.
Strategy Principle
The Stochastic Oscillator consists of the %K line and the %D line. The %K line measures the position of the closing price relative to the high and low prices over a specified period. The %D line is a moving average of the %K line, used to smooth the %K line and generate more reliable signals. When the %K line crosses the %D line, it indicates a change in price momentum, which can be interpreted as a potential buy or sell signal.
This strategy uses the crossovers of the Stochastic Oscillator to identify potential trend reversals or momentum changes. When the %K line crosses above the %D line and the %K value is below 20 (indicating oversold conditions), the strategy generates a buy signal. Conversely, when the %K line crosses below the %D line and the %K value is above 80 (indicating overbought conditions), the strategy generates a sell signal. This approach attempts to capture shifts in the trend before a price reversal occurs.
Strategy Advantages
- Simplicity: The strategy is based on a widely used technical indicator and is easy to understand and implement.
- Trend identification: By using the crossovers of the Stochastic Oscillator, the strategy can identify potential trend reversals and momentum changes.
- Overbought/oversold signals: By combining the crossovers of the Stochastic Oscillator with overbought/oversold levels, the strategy attempts to identify extreme conditions before a price reversal occurs.
Strategy Risks
- False signals: The Stochastic Oscillator may generate false signals, leading to unprofitable trades.
- Lag: As a lagging indicator, the Stochastic Oscillator may generate signals after the price has already reversed.
- Lack of trend confirmation: The strategy may generate frequent trading signals in choppy markets, resulting in overtrading and potential losses.
Strategy Optimization
- Trend confirmation: Additional technical indicators or price action analysis can be incorporated to confirm the trend before generating trading signals. This can help filter out false signals in choppy markets.
- Dynamic parameters: The parameters of the Stochastic Oscillator can be dynamically adjusted based on market volatility or other market conditions to optimize the strategy's performance.
- Risk management: Proper stop-loss and position sizing controls can be implemented to limit potential losses and protect profits.
Summary
The Stochastic Crossover Indicator Momentum Trading Strategy uses the crossovers of the Stochastic Oscillator to identify potential buying and selling opportunities while considering the overbought/oversold state of the asset. Although the strategy is simple and can identify trend reversals, it may also generate false signals and lack trend confirmation. By incorporating trend confirmation indicators, dynamic parameter optimization, and risk management, the strategy's performance can be further enhanced. However, it is essential to thoroughly test and evaluate the strategy under different market conditions before implementation.
- 1