概述
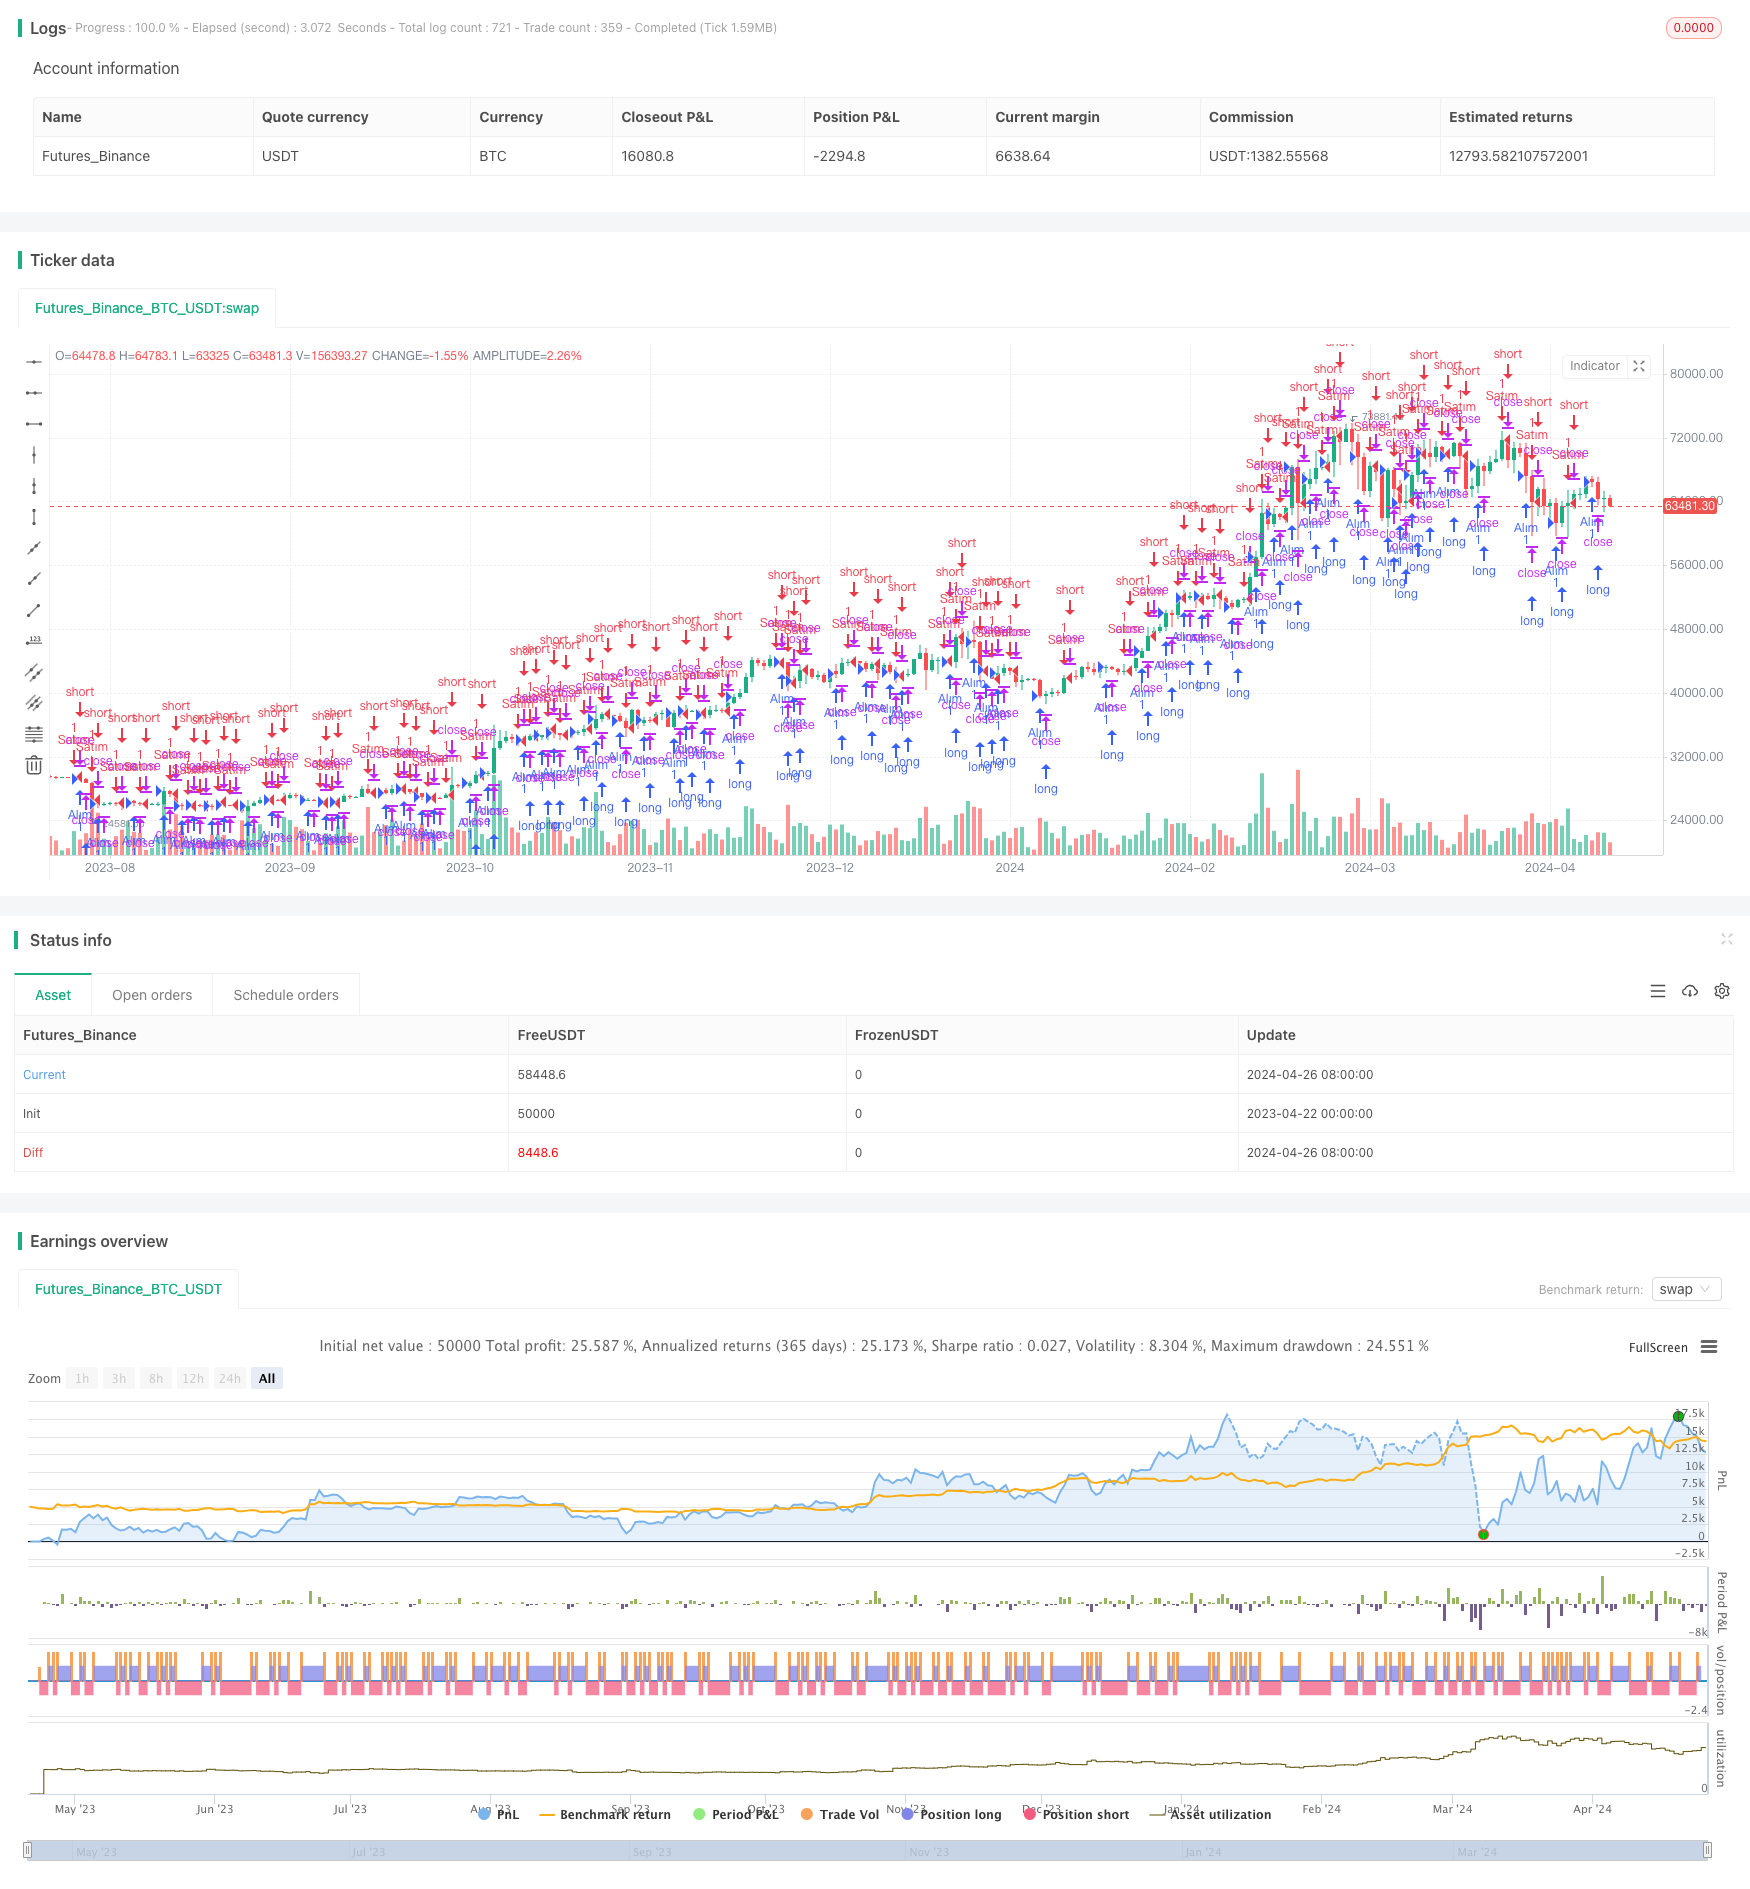
该策略使用高级时间框架(HTF)的ZigZag指标,在较低的时间框架(LTF)上绘制ZigZag路径,并根据HTF蜡烛线的开盘价和收盘价产生交易信号。策略的主要思路是利用HTF的趋势方向来指导LTF的交易决策,同时使用ZigZag指标来确定关键的支撑和阻力位置。
策略原理
- 获取用户指定的HTF时间框架(默认为15分钟)的数据,包括开盘价、最高价、最低价、收盘价、开盘时间和收盘时间。
- 在LTF图表上绘制HTF蜡烛线的方框,以显示HTF的价格走势。
- 使用ZigZag指标连接HTF的高点和低点,形成ZigZag路径。
- 根据HTF蜡烛线的开盘价和收盘价产生交易信号:
- 如果HTF蜡烛线的收盘价低于开盘价,则产生做多信号。
- 如果HTF蜡烛线的收盘价高于开盘价,则产生做空信号。
- 根据交易信号执行相应的买入或卖出操作。
策略优势
- 利用HTF的趋势方向来指导LTF的交易决策,可以帮助交易者把握大趋势,提高交易成功率。
- 使用ZigZag指标连接HTF的高点和低点,可以清晰地显示价格的关键支撑和阻力位置,为交易决策提供参考。
- 策略逻辑简单明了,易于理解和实现。
- 通过在LTF图表上绘制HTF蜡烛线的方框,可以直观地观察HTF价格走势与LTF价格走势的关系,有助于交易者做出更加informed的决策。
策略风险
- 策略仅根据HTF蜡烛线的开盘价和收盘价产生交易信号,可能会错过一些重要的价格变动信息,导致交易机会的丢失。
- ZigZag指标可能会产生一些错误的信号,尤其是在市场波动较大或趋势不明确的情况下,需要谨慎对待。
- 策略没有考虑风险管理和仓位控制,在实际应用中可能会面临较大的风险敞口。
- 策略缺乏对市场情绪和基本面因素的考虑,可能会受到意外事件的影响而产生错误信号。
策略优化方向
- 引入更多的技术指标或市场情绪指标,如相对强弱指数(RSI)、移动平均线(MA)等,以提高交易信号的可靠性。
- 优化ZigZag指标的参数设置,如调整最小价格变动百分比或最小波动点数,以适应不同的市场环境和交易品种。
- 加入风险管理和仓位控制模块,如设置止损止盈、动态调整仓位大小等,以减少策略的风险敞口。
- 考虑引入基本面分析或市场情绪分析,如经济数据发布、重大事件等,以提高策略的适应性和稳健性。
总结
HTF Zigzag Path策略利用高级时间框架的ZigZag指标在较低时间框架上绘制ZigZag路径,并根据HTF蜡烛线的开盘价和收盘价产生交易信号。该策略的优势在于利用HTF的趋势方向来指导LTF的交易决策,同时使用ZigZag指标来确定关键的支撑和阻力位置。然而,策略也存在一些风险,如可能错过重要的价格变动信息、ZigZag指标可能产生错误信号等。为了优化策略,可以考虑引入更多的技术指标、优化ZigZag指标参数、加入风险管理和仓位控制模块,以及考虑基本面和市场情绪分析等方面。
策略源码
/*backtest
start: 2023-04-22 00:00:00
end: 2024-04-27 00:00:00
period: 1d
basePeriod: 1h
exchanges: [{"eid":"Futures_Binance","currency":"BTC_USDT"}]
*/

//@version=5
strategy("HTF Zigzag Path Strategy", overlay=true, max_boxes_count=500)

// Kullanıcıdan alınan HTF zaman çerçevesi (15 dakika)
htf_timeframe = input.timeframe("15", title="Higher Time Frame")

// Renk ayarlarını belirleme
upColor = input.color(color.white, title="Bullish Candle Color")
downColor = input.color(color.white, title="Bearish Candle Color")
zigzagColor = input.color(color.black, title="Zigzag Line Color")

// HTF verilerini almak
[htfO, htfH, htfL, htfC, htfOpenTime, htfCloseTime] = request.security(syminfo.tickerid, htf_timeframe, [open, high, low, close, time, time_close])

// Geçmiş yüksek ve düşük noktaları saklamak için değişkenler
var float prevHigh = na
var float prevLow = na

// Zigzag çizgilerini saklamak için bir dizi oluşturma
// var line[] zigzag_lines = array.new_line()

// LTF grafikte HTF mum çubuklarını göstermek için kutular oluşturma
// HTF mum çubukları kutuları
// box.new(left=htfOpenTime, top=htfH, right=htfCloseTime, bottom=htfL, border_color=downColor, border_width=1, xloc=xloc.bar_time)
// box.new(left=htfOpenTime, top=htfO, right=htfCloseTime, bottom=htfC, border_color=upColor, border_width=1, xloc=xloc.bar_time)

// Zigzag yolu oluşturmak için yüksek ve düşük noktaları bağlama
if na(prevHigh) or na(prevLow)
    prevHigh := htfH
    prevLow := htfL
else
    // Zigzag çizgilerini çiz
    // line.new(x1=bar_index - 1, y1=prevHigh, x2=bar_index, y2=htfH, color=zigzagColor, width=2)
    // line.new(x1=bar_index - 1, y1=prevLow, x2=bar_index, y2=htfL, color=zigzagColor, width=2)

    // Geçmiş yüksek ve düşük noktaları güncelle
    prevHigh := htfH
    prevLow := htfL

// Örnek işlem stratejisi
// HTF mum çubuklarının açılış ve kapanış fiyatına göre alım ve satım sinyalleri
longSignal = htfC < htfO  // Eğer HTF mum çubuğunun kapanışı açılışından düşükse, alım sinyali ver
shortSignal = htfC > htfO  // Eğer HTF mum çubuğunun kapanışı açılışından yüksekse, satım sinyali ver

// Alım işlemi
if longSignal
    strategy.entry("Alım", strategy.long)

// Satım işlemi
if shortSignal
    strategy.entry("Satım", strategy.short)
相关推荐