DCA Dual Moving Average Turtle Trading Strategy

Overview
The DCA Dual Moving Average Turtle Trading Strategy is a quantitative trading strategy based on the crossover of two moving averages and Dollar Cost Averaging (DCA). The strategy uses two Simple Moving Averages (SMAs) with different periods as buy and sell signals. When the fast SMA crosses above the slow SMA, a buy signal is generated, and when the fast SMA crosses below the slow SMA, a sell signal is generated. The strategy aims to capture medium to long-term market trends while reducing risks associated with market volatility through the use of DCA.
Strategy Principles
- Calculate the fast SMA and slow SMA.
- When the fast SMA crosses above the slow SMA, a buy signal is generated, and the strategy buys a fixed amount (DCA amount).
- When the fast SMA crosses below the slow SMA, a sell signal is generated, and the strategy sells all holdings.
- At each DCA interval (e.g., 14 days), the strategy buys an additional fixed amount to lower the average holding cost.
- The strategy reduces the average buying cost through DCA while capturing market trends using SMA crossovers.
Strategy Advantages
- Dual moving average crossovers can effectively capture medium to long-term market trends.
- The DCA method can lower the average buying cost and reduce risks associated with market volatility.
- The strategy logic is simple, easy to implement, and optimize.
- Applicable to most markets and assets, with strong versatility.
Strategy Risks
- During market fluctuations or unclear trends, frequent crossovers may lead to excessive trading signals, increasing trading costs.
- Although the DCA method can lower the average buying cost, it may increase potential losses in a persistently declining market.
- The strategy relies on historical data and may lose effectiveness when significant market changes occur.
Strategy Optimization Directions
- Optimize the SMA period parameters to find the most suitable parameter combinations for specific markets and assets.
- Introduce other technical indicators, such as RSI and MACD, to assist in judging market trends and signal reliability.
- Optimize the DCA amount and interval based on market characteristics and risk preferences.
- Incorporate stop-loss and take-profit mechanisms to control risks and returns for individual trades.
Summary
The DCA Dual Moving Average Turtle Trading Strategy captures market trends through dual moving average crossovers and reduces buying costs and risks using the DCA method. The strategy is simple, widely applicable, but requires attention to parameter optimization and risk control in practical applications. By introducing other technical indicators, optimizing DCA parameters, and incorporating stop-loss and take-profit mechanisms, the strategy's performance and stability can be further enhanced.
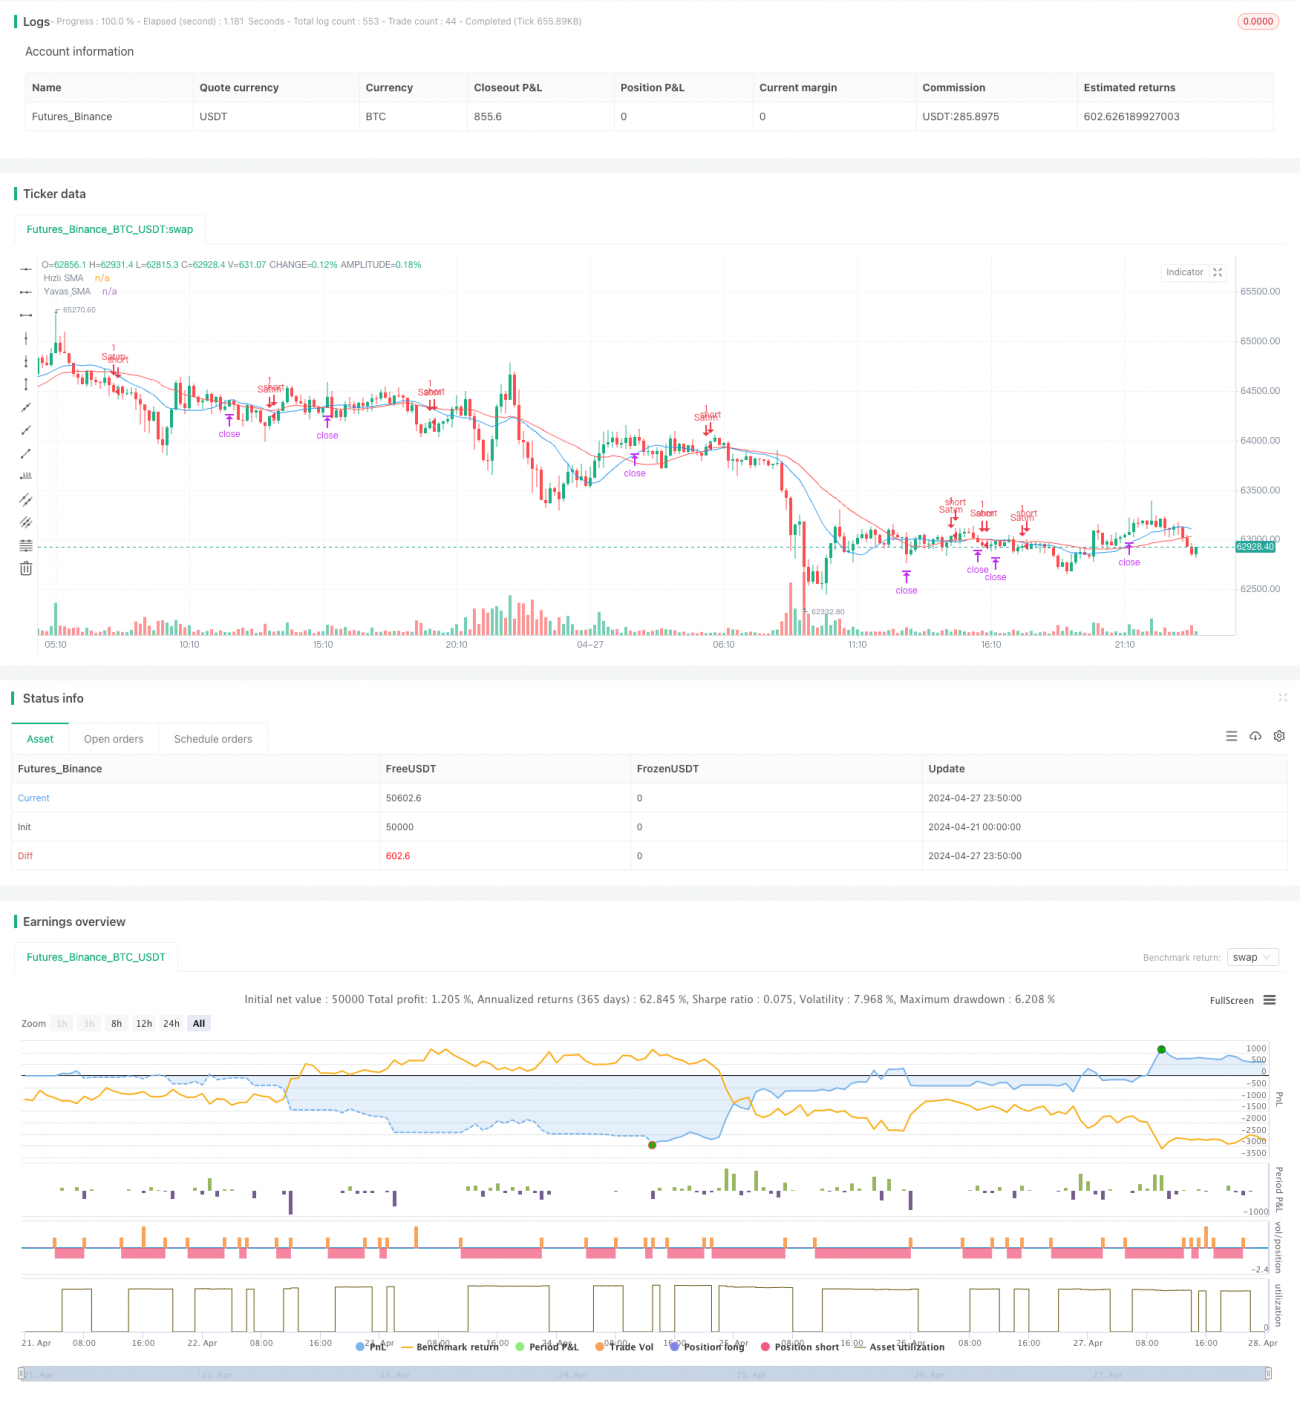
/*backtest
start: 2024-04-21 00:00:00
end: 2024-04-28 00:00:00
period: 10m
basePeriod: 1m
exchanges: [{"eid":"Futures_Binance","currency":"BTC_USDT"}]
*/

// This Pine Script™ code is subject to the terms of the Mozilla Public License 2.0 at https://mozilla.org/MPL/2.0/
// © loggolitasarim

//@version=5- 1