MACD and RSI Combined Long-term Trading Strategy

Overview
This strategy, skillfully crafted by script expert Snehashish, innovatively combines the strengths of the Moving Average Convergence Divergence (MACD) and the Relative Strength Index (RSI) to identify optimal entry and exit points in the market. The approach is meticulously designed to enter a long trade precisely when the MACD line crosses above the signal line, provided that the RSI indicated an oversold condition in the market just 5 candles prior. This timing ensures that the strategy capitalizes on the initial signs of market recovery after a sell-off, as indicated by the MACD crossover.
For closing positions, the strategy employs two critical conditions to signal an exit. First, the trade concludes when the MACD histogram is above zero, and the MACD line crosses below the signal line, indicating a potential reversal in upward momentum. Second, an exit signal is generated if the RSI was found to be in an overbought state 5 candles before, suggesting that the market may have reached a peak and could be headed for a downturn.
Snehashish's method elegantly combines these technical indicators, filtering out noise by waiting for confirmation from both MACD and RSI under specific conditions, aiming for trades with a higher probability of success. This strategic combination seeks to optimize entry and exit points, potentially enhancing the profitability of trades by leveraging the strengths of the indicators to mitigate risks associated with market volatility.
Strategy Principle
The core principle of this strategy is to combine the MACD and RSI technical indicators to capture market turning points with greater precision. The strategy enters a long trade when the RSI shows that the market has been oversold in the recent candles, followed by the MACD line crossing above the signal line. This combination ensures that the strategy opens a position as soon as the price action shows early signs of a potential reversal.
For closing positions, the strategy focuses on potential trend reversal signals indicated by the MACD and RSI. If the MACD histogram is above zero and the MACD line crosses below the signal line, the strategy exits the trade. Additionally, if the RSI had previously shown the market reaching overbought levels, it also triggers a position close. Together, these conditions imply that the strategy closes out long positions when the price may have peaked and upward momentum is waning.
Overall, by combining the signals provided by the MACD and RSI, the strategy aims to open positions as soon as a trend shows early signs of reversing and close positions when the trend may be ending, thus optimizing entry and exit points to enhance overall trading performance.
Strategy Advantages
- By combining the MACD and RSI indicators, the strategy can more accurately capture market turning points, optimizing entry and exit timings.
- The RSI is used to confirm oversold and overbought market conditions, while the MACD line crossing the signal line provides an entry signal, making the combination of the two indicators a more reliable predictor of price movements.
- Waiting for the RSI to confirm an oversold state before entering a position helps avoid premature entries during a downtrend.
- Exiting when the MACD histogram is above zero and the MACD line crosses below the signal line allows for timely closure of long positions towards the end of an uptrend, avoiding potential pullback risks.
- Flexible parameter settings, such as the overbought and oversold thresholds for RSI and the fast and slow line periods for MACD, allow users to optimize the strategy according to their risk preferences and market characteristics.
Strategy Risks
- In choppy markets, frequent MACD and RSI signals may lead to overtrading, increasing transaction costs and potential losses.
- If the market trend is strong, the RSI may remain in the overbought zone for an extended period, causing the strategy to miss out on some of the upside.
- The strategy relies primarily on lagging indicators, which may not allow for timely position adjustments during sudden market reversals.
- The performance of the strategy is heavily influenced by parameter settings, and inappropriate parameters may result in numerous false signals, reducing the strategy's efficiency.
To mitigate these risks, one can consider introducing other leading indicators as filters, optimizing parameters to suit different market conditions, and setting appropriate stop-losses and take-profits to manage risk on individual trades.
Strategy Optimization Directions
- Incorporate additional technical indicators, such as Bollinger Bands, moving averages, etc., to provide extra trend confirmation and support/resistance level identification, enhancing signal reliability.
- Optimize the parameters for RSI and MACD to find the most suitable combinations for the current market conditions and target assets, reducing false signals.
- Introduce market environment analysis, such as trading volume, volatility, etc., to dynamically adjust strategy parameters based on different market states, improving adaptability.
- Implement appropriate position sizing rules, such as adjusting position sizes based on signal strength and risk levels, to manage overall risk exposure.
- Regularly backtest and evaluate strategy performance, promptly adjusting strategy logic and parameters based on market changes to ensure the strategy remains effective and robust.
By implementing these optimization measures, the risk-adjusted returns of the strategy can be further enhanced, making it better suited to navigate the ever-changing market environment.
Conclusion
Snehashish's long-term trading strategy skillfully combines the MACD and RSI technical indicators to capture market turning points with greater precision, optimizing entry and exit timings. By waiting for the RSI to confirm an oversold state and using the MACD line crossing the signal line as an entry signal, the strategy can enter positions as soon as a trend shows early signs of reversing. Similarly, by utilizing the relative positions of the MACD histogram and signal line, along with the RSI's overbought signal, the strategy can exit positions in a timely manner when an uptrend may be ending.
Although the strategy shows good potential, it still carries some risks, such as overtrading in choppy markets and signal lag during strong trends. To mitigate these risks, one can consider introducing other indicators, optimizing parameter settings, enhancing market environment analysis, and improving position sizing, among other measures.
Overall, this MACD and RSI-based long-term trading strategy provides investors with a reliable framework for capturing market turning points and optimizing entry and exit timings. With further optimization and refinement, the strategy could become a powerful tool for investors to achieve robust long-term returns in the face of changing market conditions.
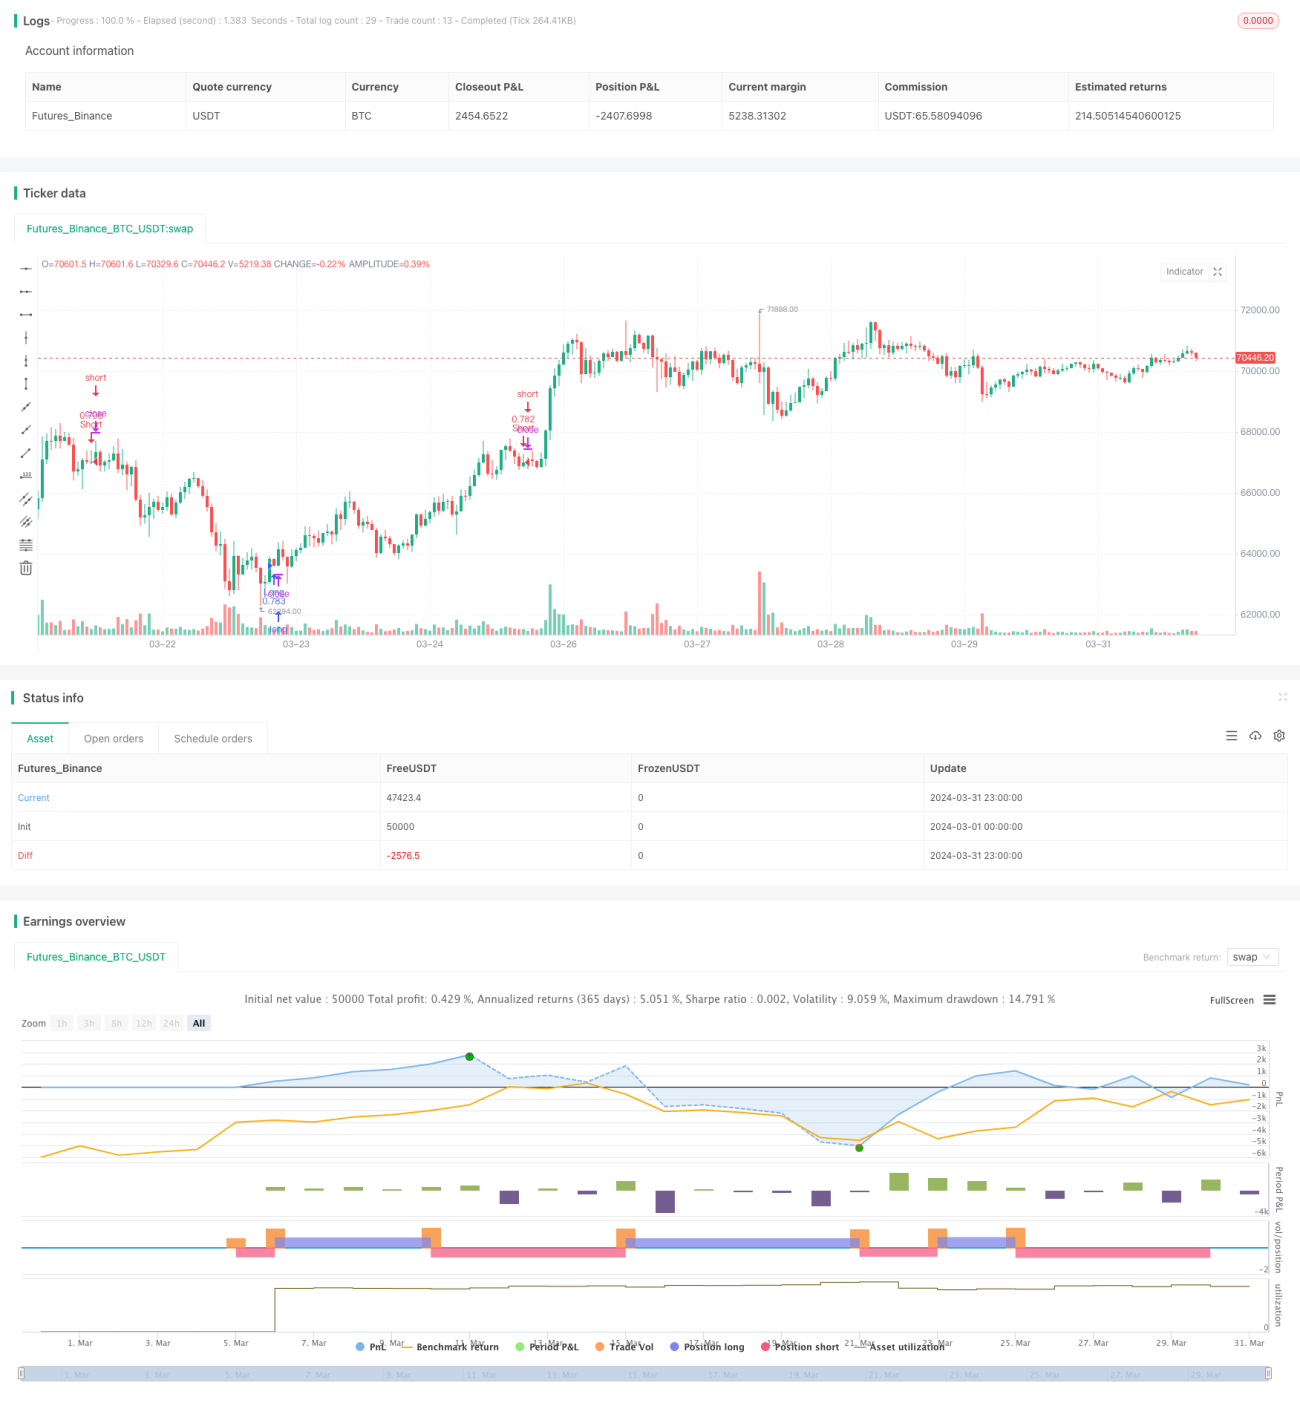
/*backtest
start: 2024-03-01 00:00:00
end: 2024-03-31 23:59:59
period: 1h
basePeriod: 15m
exchanges: [{"eid":"Futures_Binance","currency":"BTC_USDT"}]
*/

//@version=5
// snehashish 2024
strategy(title='spl Long Strategy', initial_capital=100000, default_qty_type=strategy.percent_of_equity, default_qty_value=100, pyramiding=0, currency='USD', overlay=true)
- 1