
Overview
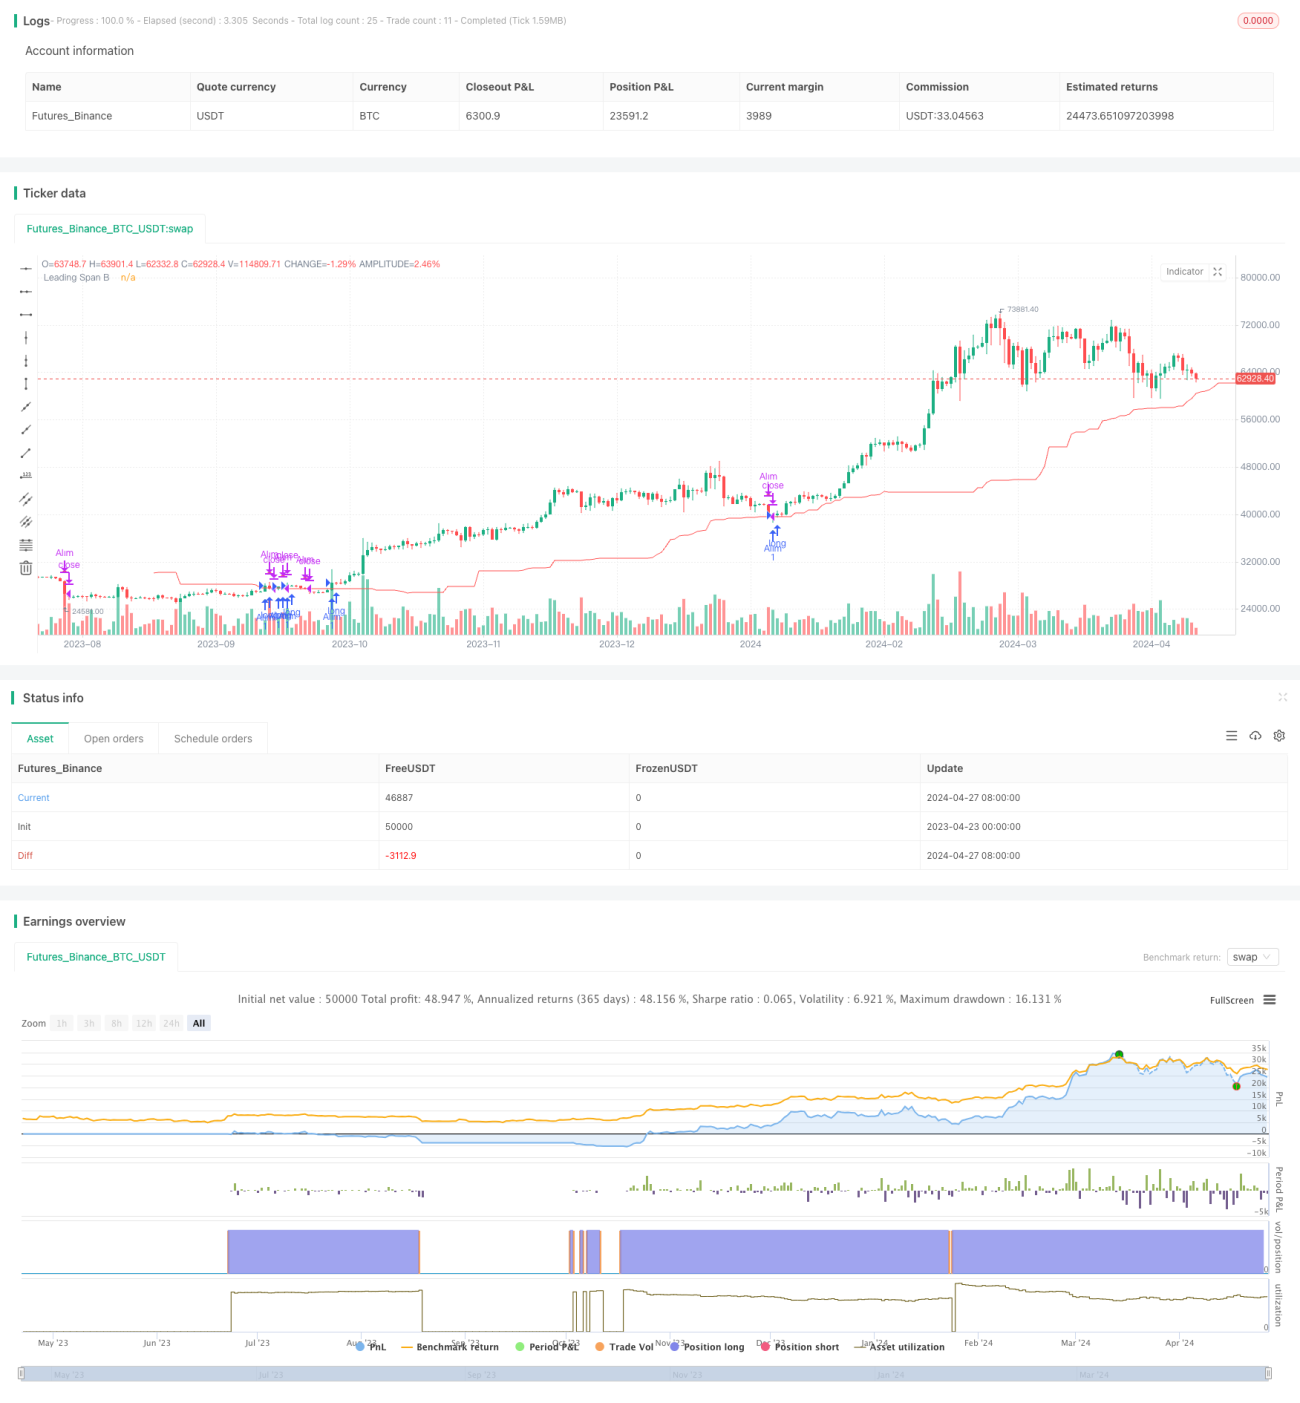
This strategy is based on the Leading Span B line of the Ichimoku Cloud indicator. It generates trading signals when the price breaks through the Leading Span B line. A buy signal is generated when the price breaks above the Leading Span B line, and a sell signal is generated when the price breaks below the Leading Span B line. The strategy leverages the predictive power of the Leading Span B line in the Ichimoku Cloud indicator for future price trends, aiming to capture good trading opportunities by timely detecting the price breakout of the Leading Span B line.
Strategy Principle
- Calculate the Conversion Line (Tenkan-sen), Base Line (Kijun-sen), Leading Span A (Senkou Span A), and Leading Span B (Senkou Span B) of the Ichimoku Cloud indicator.
- When the closing price breaks above the Leading Span B line, a buy signal is generated, and a long position is opened.
- When the closing price breaks below the Leading Span B line, a sell signal is generated, and the position is closed.
- Mark the buy and sell signals on the chart for intuitive observation.
Strategy Advantages
- The strategy is based on the Ichimoku Cloud indicator, which comprehensively considers price information from multiple time dimensions, providing a more comprehensive market analysis.
- It utilizes the predictive power of the Leading Span B line for future price movements to capture trending opportunities.
- The strategy logic is simple and clear, easy to understand and implement.
- By marking buy and sell signals on the chart, it facilitates traders to intuitively grasp trading timing.
Strategy Risks
- The strategy relies on a single indicator, which may face the risk of indicator failure.
- In a volatile market, frequent price breakouts may lead to excessive trading signals, increasing trading costs.
- The strategy does not set stop-loss, facing potential risks of large losses.
Strategy Optimization Directions
- Combine with other technical indicators or price behavior characteristics to further confirm trading signals and improve signal reliability.
- Introduce position management and risk control mechanisms, such as setting reasonable stop-loss and take-profit levels to control single-trade risk.
- Optimize strategy parameters, such as adjusting the calculation period of the Ichimoku Cloud indicator to adapt to different market conditions.
- Consider trading cost factors and set appropriate signal filtering mechanisms to reduce frequent trading.
Summary
The Ichimoku Leading Span B Breakout Strategy is a trading strategy based on the Leading Span B line of the Ichimoku Cloud indicator. By capturing the timing of price breakouts of the Leading Span B line, it aims to obtain trending trading opportunities. The strategy's advantages are its simple logic, easy implementation, and ability to comprehensively consider price information from multiple time dimensions. However, it also faces potential risks such as single indicator failure, frequent trading, and lack of risk control. Therefore, in practical application, it is necessary to optimize the strategy by combining other indicators, optimizing parameter settings, introducing risk control measures, etc., to improve the strategy's robustness and profitability.
- 1