Multi-Timeframe Bitcoin, Binance Coin, and Ethereum Pullback Trading Strategy

Overview
This strategy focuses on Bitcoin (BTC), Binance Coin (BNB), and Ethereum (ETH) across 1-hour, 2-hour, 3-hour, and 4-hour time frames. It aims to capitalize on short-term price pullbacks within the broader trend. By identifying retracements against the prevailing trend and using confirmation signals like candlestick patterns and oversold conditions, traders can enter positions with defined risk and profit targets. Effective risk management, including stop-loss orders and position sizing, is crucial. This strategy provides a structured approach to trading pullbacks while managing downside risk.
Strategy Principles
The strategy employs two Simple Moving Averages (SMAs) to capture market trends and potential pullback opportunities. The longer-period SMA (ma1) serves as a trend confirmation indicator, while the shorter-period SMA (ma2) is used to identify price deviations from the primary trend. When the price is above ma1, it indicates an uptrend, and the strategy looks for pullbacks below ma2 as potential entry points. Additionally, the strategy incorporates "Too Deep" and "Too Thin" parameters to filter out pullbacks, avoiding overly deep or shallow retracements. Once a buy signal is confirmed, the strategy executes a market buy order. Exit conditions include price breakouts above ma2 or hitting a predefined stop-loss level. The strategy leverages the principles of trend-following and pullback trading to capture short-term retracement opportunities within the prevailing trend.
Strategy Advantages
- Multi-timeframe analysis: The strategy operates on 1-hour, 2-hour, 3-hour, and 4-hour time frames, providing a more comprehensive market perspective and potential trading opportunities.
- Trend-following: By using the longer-period SMA as a trend confirmation indicator, the strategy adapts to different market trends and seeks entry opportunities within the trend.
- Pullback trading: The strategy focuses on identifying price retracements within an uptrend, allowing for better entry prices while reducing the risk of trading against the trend.
- Risk management: The strategy incorporates stop-loss mechanisms and position sizing controls to limit potential downside risk and protect trading capital.
- Parameter optimization: Strategy parameters such as moving average lengths and stop-loss percentages can be optimized based on market conditions and personal preferences, providing flexibility.
Strategy Risks
- Parameter sensitivity: The performance of the strategy is somewhat dependent on the chosen parameters, such as moving average lengths and pullback filters. Careful backtesting and optimization of these parameters are required.
- Market noise: Short-term price fluctuations can lead to false signals, resulting in unnecessary trades and increased costs.
- Trend reversals: When market trends suddenly reverse, the strategy may face potential losses, especially before the stop-loss levels are triggered.
- Slippage and trading costs: Frequent trading can result in higher slippage and transaction costs, impacting the overall performance of the strategy.
Strategy Optimization Directions
- Dynamic stop-loss: Adjust stop-loss levels based on market volatility or price behavior to better adapt to different market conditions.
- Multi-factor confirmation: Incorporate additional technical indicators such as the Relative Strength Index (RSI) or Stochastic Oscillator to confirm trends and pullbacks, enhancing signal reliability.
- Risk-adjusted position sizing: Dynamically adjust the position size for each trade based on current market volatility or personal risk tolerance.
- Trading session optimization: Analyze price behavior and volatility during different trading sessions to identify the most favorable trading periods for improved strategy performance.
- Incorporation of market sentiment analysis: Integrate market sentiment indicators like the Fear and Greed Index to better gauge market mood and potential turning points.
Summary
This multi-timeframe Bitcoin, Binance Coin, and Ethereum pullback trading strategy offers a structured approach to capture short-term retracement opportunities within the prevailing trend. By combining the principles of trend-following and pullback trading and applying appropriate risk management measures, the strategy aims to optimize potential trading opportunities. However, the performance of the strategy is subject to parameter selection and market conditions, requiring ongoing monitoring and optimization. By incorporating enhancements such as dynamic stop-loss, multi-factor confirmation, and market sentiment analysis, the robustness and adaptability of the strategy can be further improved. Thorough backtesting, parameter optimization, and risk assessment are essential before implementing this strategy.
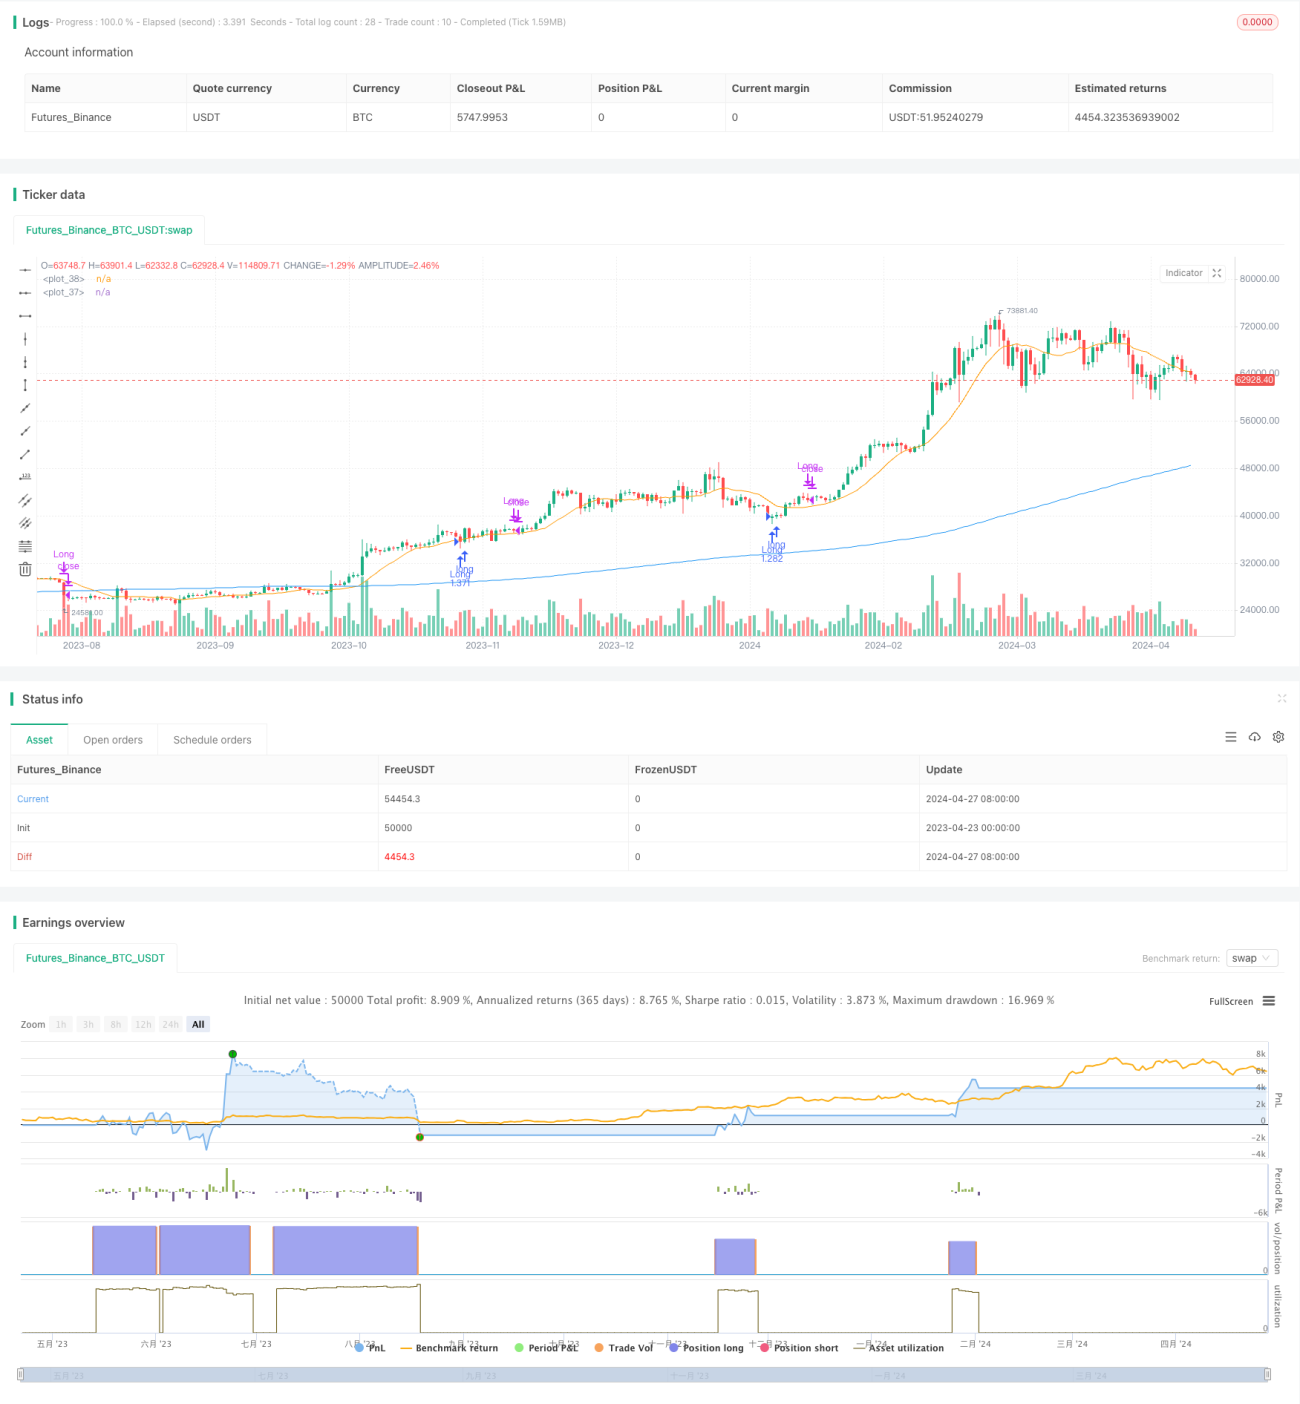
/*backtest
start: 2023-04-23 00:00:00
end: 2024-04-28 00:00:00
period: 1d
basePeriod: 1h
exchanges: [{"eid":"Futures_Binance","currency":"BTC_USDT"}]
*/

// This Pine Script™ code is subject to the terms of the Mozilla Public License 2.0 at https://mozilla.org/MPL/2.0/
// © GOLU_PARDHAAN

//@version=5- 1