概述
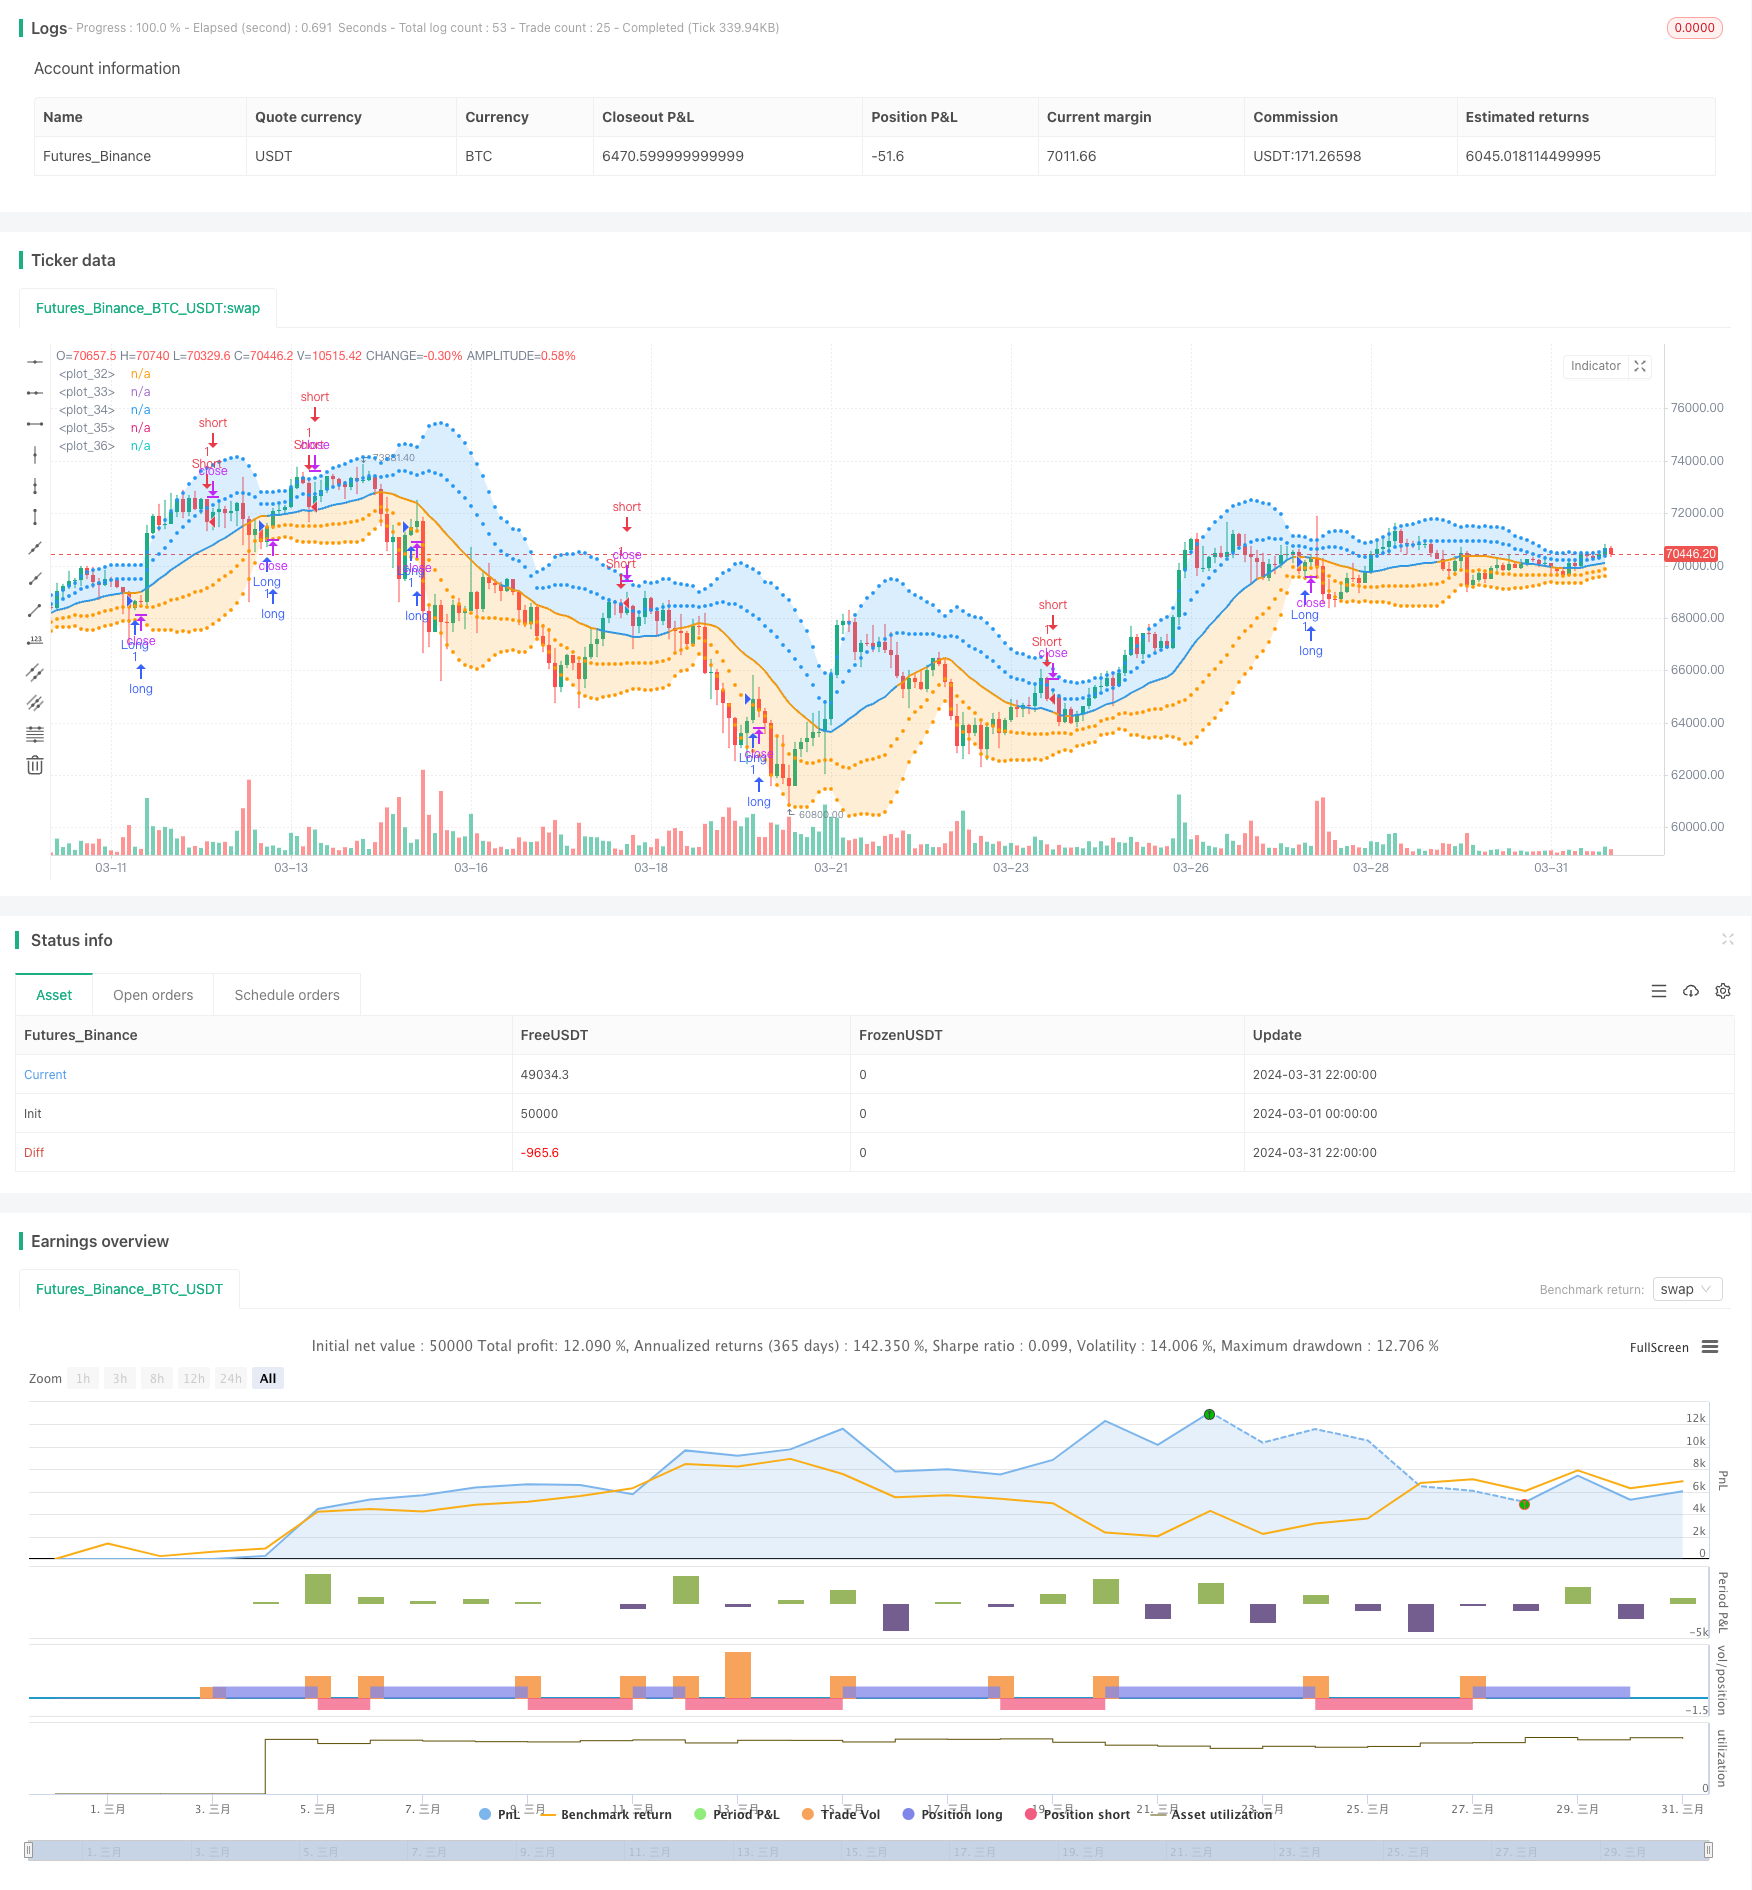
该策略基于布林带指标,通过双层标准差过滤,在5分钟时间框架上实现快速交易。当价格跌破下轨时买入,突破上轨时卖出。上下轨由不同标准差设定,并使用不同颜色标识,直观显示趋势强弱。
策略原理
- 计算布林带基准线、上轨1、上轨2、下轨1和下轨2。
- 当收盘价从下轨1下方向上穿越时,产生买入信号。
- 当收盘价从上轨1上方向下穿越时,产生卖出信号。
- 买入后,当出现卖出信号时平仓。卖出后,当出现买入信号时平仓。
- 上轨2和下轨2标识趋势强度,提供辅助判断。
策略优势
- 双层标准差设置提高了趋势判断的准确性。
- 5分钟级别的交易频率高,适合快进快出。
- 趋势强度辅助判断有助于风险控制。
- 参数可调,适应不同市场。
策略风险
- 频繁交易可能导致高额手续费。
- 趋势判断误差会带来亏损。
- 缺乏止损措施,风险暴露较大。
- 对单边趋势把握不足。
策略优化方向
- 引入止损和止盈机制,控制单笔交易风险。
- 优化布林带参数,提高趋势捕捉能力。
- 加入趋势判断辅助指标,如MA,提高胜率。
- 针对震荡行情设置过滤条件。
总结
该策略利用布林带的统计特性,双层过滤增强趋势判断,适合在5分钟级别快速捕捉趋势机会。但频繁交易和风控措施不足的问题仍需优化。未来可继续完善止损止盈、参数优选和辅助判断等方面,提升整体稳健性和盈利能力。
策略源码
/*backtest
start: 2024-03-01 00:00:00
end: 2024-03-31 23:59:59
period: 2h
basePeriod: 15m
exchanges: [{"eid":"Futures_Binance","currency":"BTC_USDT"}]
*/

//@version=5
//This displays the traditional Bollinger Bands, the difference is
//that the 1st and 2nd StdDev are outlined with two colors and two
//different levels, one for each Standard Deviation

strategy("Five Min Scalping Strategy", overlay=true)

src = input(close, title="Source")
length = input.int(20, minval=1, title="Length")
mult = input.float(2.0, minval=0.001, maxval=50, title="Multiplier")

basis = ta.sma(src, length)
dev = ta.stdev(src,length)
dev2 = mult * dev

upper1 = basis + dev
lower1 = basis - dev
upper2 = basis + dev2
lower2 = basis - dev2

LongCondition = close[1] < lower1 and close > lower1
ShortCondition = close[1] > upper1 and close < upper1

strategy.entry("Long", strategy.long, when = LongCondition)
strategy.entry("Short", strategy.short, when = ShortCondition)

strategy.close("Long", when = ShortCondition)
strategy.close("Short", when = LongCondition)

colorBasis = src >= basis ? color.blue : color.orange

pBasis = plot(basis, linewidth=2, color=colorBasis)
pUpper1 = plot(upper1, color=color.new(color.blue, 0), style=plot.style_circles)
pUpper2 = plot(upper2, color=color.new(color.blue, 0), style=plot.style_circles)
pLower1 = plot(lower1, color=color.new(color.orange, 0), style=plot.style_circles)
pLower2 = plot(lower2, color=color.new(color.orange, 0), style=plot.style_circles)

fill(pBasis, pUpper2, color=color.new(color.blue, 80))
fill(pUpper1, pUpper2, color=color.new(color.blue, 80))
fill(pBasis, pLower2, color=color.new(color.orange, 80))
fill(pLower1, pLower2, color=color.new(color.orange, 80))
相关推荐