Bollinger Bands Stochastic Oscillator Strategy

Overview
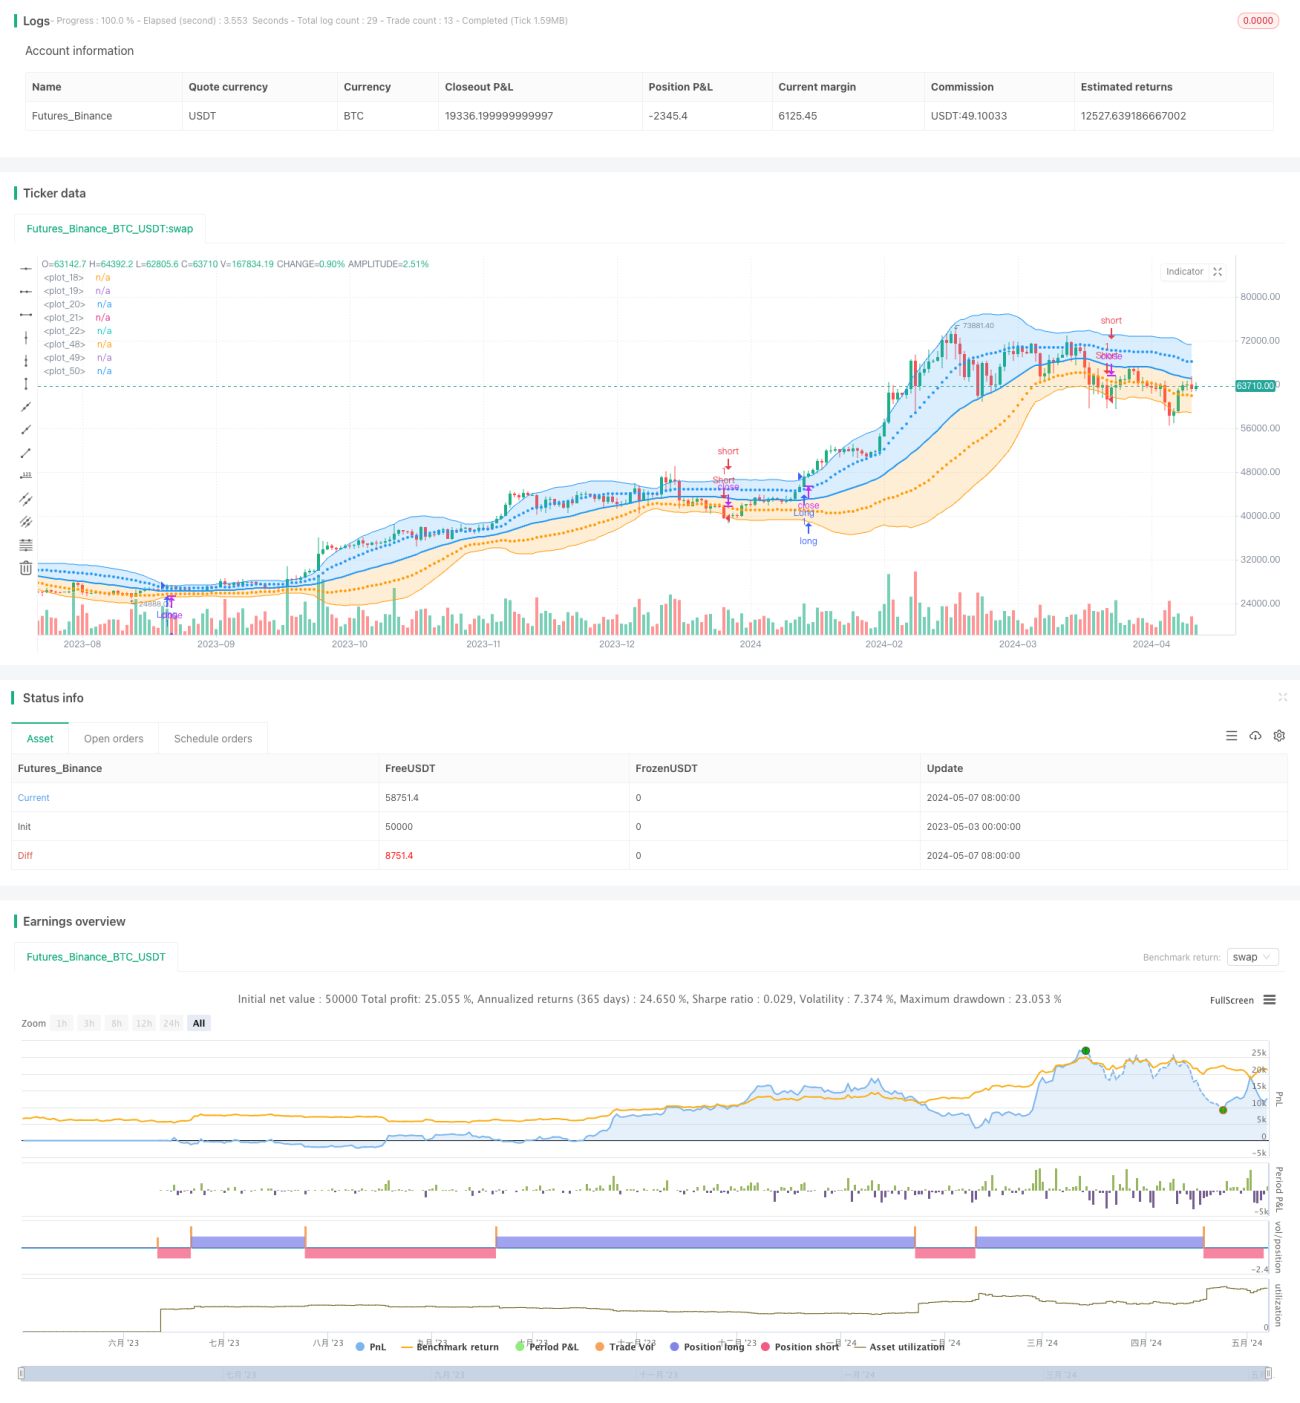
This strategy is a trading strategy based on Bollinger Bands and the Stochastic Oscillator. It utilizes Bollinger Bands to determine the market's volatility range and uses the Stochastic Oscillator to judge the overbought and oversold states of the market. When the price breaks above the upper Bollinger Band, the strategy goes long; when the price falls below the lower Bollinger Band, the strategy goes short. At the same time, the strategy also uses the Stochastic Oscillator to filter trading signals to improve the accuracy and reliability of the strategy.
Strategy Principle
The core of this strategy is two technical indicators: Bollinger Bands and the Stochastic Oscillator. Bollinger Bands consist of three lines: the middle band, the upper band, and the lower band. The middle band is a simple moving average of the price, while the upper and lower bands are the middle band plus and minus a certain multiple of the price's standard deviation. When the price breaks above the upper band, it indicates that the market may be overbought; when the price falls below the lower band, it indicates that the market may be oversold.
The Stochastic Oscillator consists of two lines: the %K line and the %D line. The %K line measures the position of the closing price within the highest and lowest prices over a recent period, and the %D line is a moving average of the %K line. When the %K line crosses above the %D line, it indicates that the market may be overbought; when the %K line crosses below the %D line, it indicates that the market may be oversold.
This strategy combines these two indicators. When the price breaks above the upper Bollinger Band and the Stochastic Oscillator %K line crosses above the %D line, the strategy goes long; when the price falls below the lower Bollinger Band and the Stochastic Oscillator %K line crosses below the %D line, the strategy goes short. This combination can effectively capture market trends while avoiding frequent trading in volatile markets.
Strategy Advantages
- It combines indicators of both trending and oscillating market states, enabling it to obtain stable returns in different market environments.
- Bollinger Bands can dynamically adjust to adapt to changes in market volatility, improving the strategy's adaptability.
- The Stochastic Oscillator can effectively filter out some false breakout signals, improving the accuracy of the strategy.
- The strategy logic is clear and easy to understand and implement, making it suitable for traders of different levels.
Strategy Risks
- In situations where the market trend is unclear or volatility is high, the strategy may generate many false signals, leading to frequent trading and losses.
- The strategy relies on historical data and may experience significant drawdowns in the face of unexpected events or market anomalies.
- The choice of strategy parameters has a significant impact on strategy performance, and different parameters may lead to completely different results.
Strategy Optimization Directions
- Consider adding more filtering conditions, such as trading volume, other technical indicators, etc., to further improve the reliability of signals.
- Optimize the parameters of Bollinger Bands and the Stochastic Oscillator to find the parameter combination that best suits the current market.
- Introduce risk management mechanisms, such as stop-loss and trailing stop-loss, to control the risk of a single trade.
- Consider combining this strategy with other strategies to form a more robust strategy portfolio.
Summary
This strategy is a simple yet effective trading strategy that combines two classic technical indicators, Bollinger Bands and the Stochastic Oscillator, to achieve stable returns in both trending and oscillating market states. Although the strategy also has some risks and limitations, through proper optimization and improvement, it can further enhance the strategy's performance and adaptability, becoming a trading strategy worth referencing and learning from.
- 1