MOST and Dual Moving Average Crossover Strategy

Overview
The MOST and Dual Moving Average Crossover Strategy is a quantitative trading strategy that combines multiple technical indicators. The strategy utilizes the crossover signals of two moving averages (MA) with different periods and the MOST indicator to determine overbought and oversold conditions of prices, generating buy and sell signals. A buy signal is generated when the fast MA crosses above the slow MA, and a sell signal is generated when the opposite occurs. At the same time, the MOST indicator is used to confirm the overbought and oversold conditions of prices to avoid frequent trading during volatile price movements.
Strategy Principles
The core of this strategy is to utilize the trend characteristics of moving averages with different periods and the overbought and oversold conditions of prices. Specifically:
- Calculate the fast MA and slow MA. The fast MA is more sensitive to price changes, while the slow MA is relatively lagging.
- Determine the relative position of the fast MA and slow MA. When the fast MA crosses above the slow MA, it suggests that the price may enter an upward trend, generating a buy signal; when the fast MA crosses below the slow MA, it suggests that the price may enter a downward trend, generating a sell signal.
- Use the MOST indicator to determine the overbought and oversold conditions of prices. When the price continues to rise and exceeds the MOST indicator, it suggests that the price may be overbought, and caution should be exercised when buying; when the price continues to fall and is lower than the MOST indicator, it suggests that the price may be oversold, and caution should be exercised when selling.
By combining the MA crossover signals and the MOST indicator, this strategy can better capture price trends and avoid frequent trading during volatile price movements.
Strategy Advantages
- Trend tracking: By utilizing the crossover signals of MAs with different periods, this strategy can better capture the medium and long-term trends of prices.
- Noise reduction: By combining the MOST indicator to determine overbought and oversold conditions of prices, this strategy can effectively filter out short-term noise in prices and avoid frequent trading.
- Parameter flexibility: The parameters of this strategy (such as MA periods, MOST period, etc.) can be flexibly adjusted according to different markets and instruments to adapt to different market characteristics.
Strategy Risks
- Parameter optimization: The performance of this strategy depends on the selection of parameters, such as MA periods, MOST period, etc. Inappropriate parameters may lead to poor strategy performance. Therefore, parameter optimization is necessary for practical application.
- Market adaptability: This strategy performs well in markets with obvious trends but may perform poorly in range-bound markets. Therefore, the strategy needs to be adjusted according to market characteristics.
- Slippage and transaction costs: Frequent trading may lead to high slippage and transaction costs, affecting the net return of the strategy. Therefore, these factors need to be considered in practical application.
Strategy Optimization Directions
- Dynamic parameter optimization: Consider dynamically adjusting strategy parameters according to changes in market conditions, such as using longer-period MAs during obvious trends and shorter-period MAs in range-bound markets.
- Stop-loss and take-profit: Add stop-loss and take-profit mechanisms to reduce the risk exposure of a single trade.
- Position management: Dynamically adjust positions based on factors such as market volatility and risk preferences to control overall risk.
Summary
The MOST and Dual Moving Average Crossover Strategy combines the crossover signals of MAs with different periods and the MOST indicator's determination of overbought and oversold conditions of prices, allowing for better capture of price trends and avoidance of frequent trading. The strategy is logical, easy to implement, and can be flexibly adjusted according to different market characteristics. However, in practical application, factors such as parameter optimization, market adaptability, slippage, and transaction costs need to be considered. In addition, mechanisms such as dynamic parameter optimization, stop-loss and take-profit, and position management can be added to further improve the robustness and profitability of the strategy.
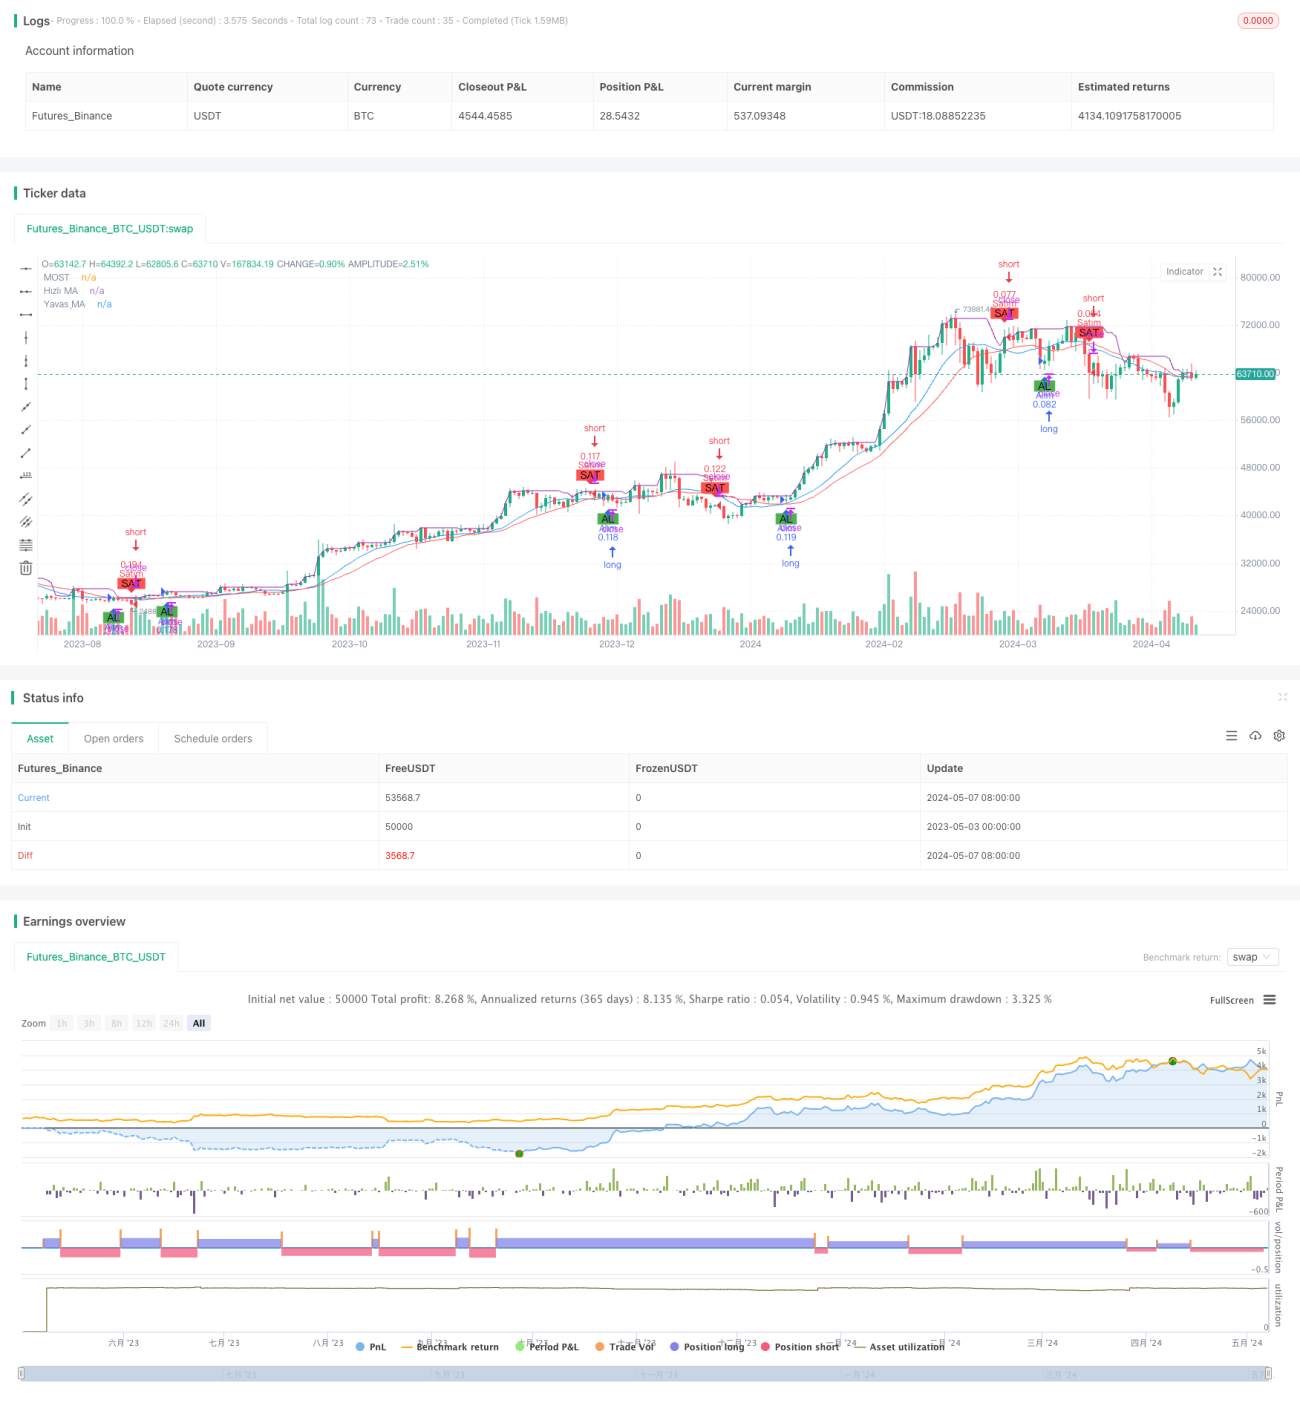
/*backtest
start: 2023-05-03 00:00:00
end: 2024-05-08 00:00:00
period: 1d
basePeriod: 1h
exchanges: [{"eid":"Futures_Binance","currency":"BTC_USDT"}]
*/

//@version=5
strategy("MOST ve Hareketli Ortalama Kesişimleri", overlay=true, default_qty_type=strategy.percent_of_equity, default_qty_value=10)

// Girdi parametrelerini tanımlayın- 1