概述
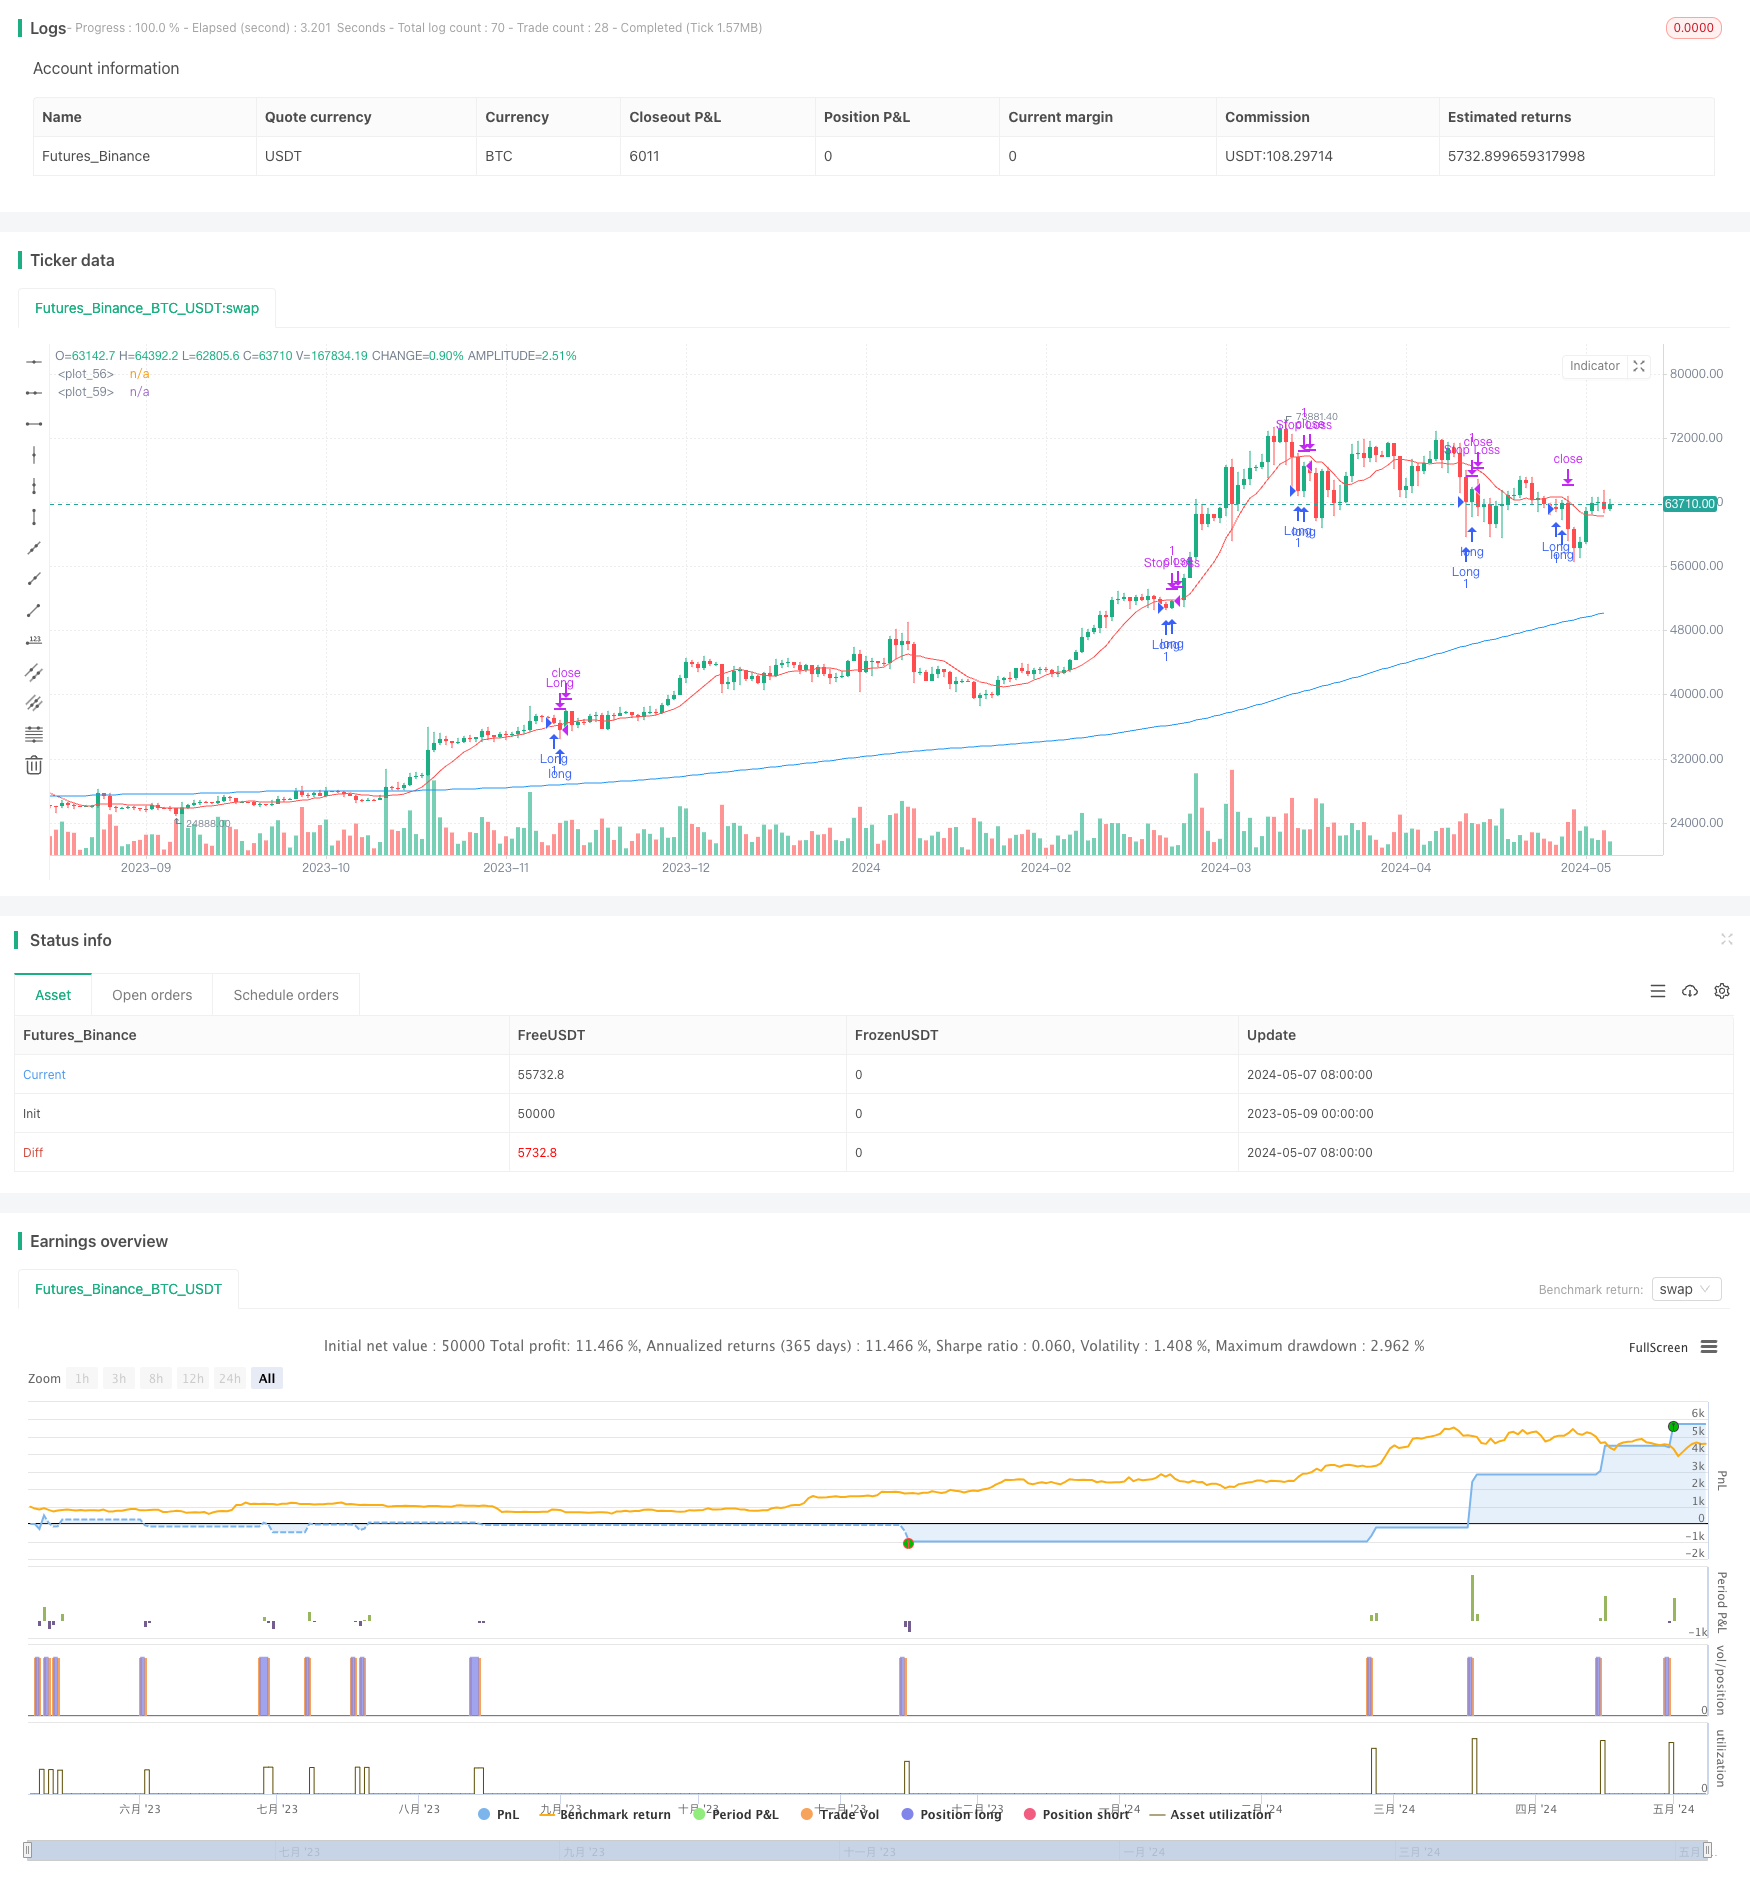
该交易策略基于连续三根阴线的形态和均线系统来判断交易信号。当价格在200日均线上方,并且出现连续三根阴线的形态时,开仓做多。策略通过动态止盈和止损的方式来管理交易风险,止盈和止损点位根据短期均线的位置和价格变化百分比来确定。策略只在指定的时间范围内进行交易。
策略原理
- 计算连续阴线的数量,当出现指定数量(默认为3)的连续阴线时,认为形成做多信号。
- 使用两条均线来辅助判断趋势和交易时机,默认使用10日均线和200日均线。只有当价格在200日均线上方时,才考虑做多。
- 设置动态止盈和止损点位。止盈点为开仓价格上方一定百分比(默认为1.5%),止损点为开仓价格下方一定百分比(默认为1%)。
- 另一个平仓条件是价格相对10日均线的位置发生变化。如果多头持仓时,价格从均线上方回落到下方,则平仓。
- 策略只在指定的时间范围内运行,根据开始日期和结束日期来确定。
策略优势
- 结合价格形态和均线系统,可以较好地捕捉趋势性机会。
- 通过动态止盈和止损,可以灵活控制风险和收益。止盈点随着价格上涨而不断抬高,让利润奔跑;止损点限制了最大损失。
- 利用短期均线的位置变化作为平仓信号,可以快速应对价格的突然反转。
- 指定交易时间范围,可以避免在市场关闭或节假日等特殊时期交易,降低风险。
策略风险
- 连续阴线形态并不能完全确定趋势反转,可能出现连续阴线后价格继续上涨的情况,导致策略失效。
- 固定百分比的止盈止损点位,可能无法应对市场的剧烈波动。在趋势很强时,止盈点位可能设置过低,导致提前离场;在波动加剧时,止损点位可能过于靠近,导致频繁止损。
- 短期均线位置的判断可能出现滞后,特别是在价格快速变化时,可能已经错过最佳平仓时机。
- 策略缺乏仓位管理和风险控制的措施,入场点位和头寸规模都是固定的,可能导致单次交易风险过大。
策略优化方向
- 可以引入更多的技术指标来辅助判断,如MACD、RSI等,提高信号的可靠性。
- 优化止盈和止损点位的计算方式,如使用ATR或波动率来动态调整,或者结合支撑阻力位来设置。
- 对于平仓信号,可以考虑使用更多的确认条件,如成交量变化、多空头持仓比例等,避免出现错误信号。
- 引入仓位管理和风险控制措施,如根据账户余额和风险水平来调整每次交易的头寸大小,设置总体风险限额等。
- 对于参数设置,如连续阴线的数量、均线周期等,可以进行优化测试,寻找最佳的参数组合。
总结
该交易策略通过连续阴线形态和均线系统来判断趋势性交易机会,同时利用动态止盈止损和短期均线位置变化来控制风险。策略思路清晰,适合把握中长期趋势的交易者。但是策略也存在一些局限性,如信号可靠性、止盈止损点位设置、仓位管理等方面还有优化的空间。在实际应用中,需要根据市场特点和个人风险偏好,对策略进行适当的调整和改进,并严格控制风险。
策略源码
/*backtest
start: 2023-05-09 00:00:00
end: 2024-05-08 00:00:00
period: 1d
basePeriod: 1h
exchanges: [{"eid":"Futures_Binance","currency":"BTC_USDT"}]
*/

//@version=5
strategy("Estrategia de Trading", overlay=true)

// Definir el número de cierres de velas decrecientes consecutivas
var int cierres_decrecientes_consecutivos = 0
num_cierres_decrecientes = input.int(3, title="Número de cierres decrecientes", minval=1)

// Definir el porcentaje de cambio para cerrar la operación
porcentaje_cierre_arriba = input.float(1.5, title="Porcentaje de cierre arriba (%)", step=0.1)
porcentaje_cierre_abajo = input.float(1.0, title="Porcentaje de cierre abajo (%)", step=0.1)

// Definir las medias móviles para el cierre de la operación
periodos_media_movil_cierre = input.int(10, title="Períodos de la media móvil para cierre")
periodos_media_movil_200 = input.int(200, title="Períodos de la media móvil de 200")

// Definir el rango de fechas para la simulación
start_date = timestamp(2024, 1, 1, 0, 0)
end_date = timestamp(2024, 12, 31, 23, 59)

// Calcular la media móvil para el cierre de la operación
sma_cierre = ta.sma(close, periodos_media_movil_cierre)
sma_200 = ta.sma(close, periodos_media_movil_200)

// Calcular si el precio está por encima o por debajo de la media móvil para el cierre de la operación
precio_por_encima_sma_cierre = close > sma_cierre
precio_por_debajo_sma_cierre = close < sma_cierre

// Calcular si se han producido num_cierres_decrecientes consecutivos
if (ta.change(close) < 0)
    cierres_decrecientes_consecutivos := cierres_decrecientes_consecutivos + 1
else
    cierres_decrecientes_consecutivos := 0

es_cierres_consecutivos = cierres_decrecientes_consecutivos >= num_cierres_decrecientes

// Definir condiciones de entrada y salida de la estrategia dentro del rango de fechas y con el precio por encima de la SMA de 200
condicion_entrada = es_cierres_consecutivos and close > sma_200
condicion_cierre_sma = (precio_por_encima_sma_cierre[1] and not precio_por_encima_sma_cierre) or (not precio_por_encima_sma_cierre[1] and precio_por_encima_sma_cierre)

// Calcular precios de salida basados en porcentajes
precio_salida_arriba = strategy.position_avg_price * (1 + porcentaje_cierre_arriba / 100)
precio_salida_abajo = strategy.position_avg_price * (1 - porcentaje_cierre_abajo / 100)

// Ejecutar operación en largo dentro del rango de fechas y con el precio por encima de la SMA de 200
if (condicion_entrada and strategy.opentrades == 0)
    strategy.entry("Long", strategy.long)

// Cerrar operación en largo si se cumple la condición de salida por cambio en el cruce de la media móvil dentro del rango de fechas
if (strategy.position_size > 0 and condicion_cierre_sma)
    strategy.close("Long")

// Cerrar operación en largo si el precio alcanza el porcentaje de cierre arriba o abajo dentro del rango de fechas
strategy.exit("Stop Loss", "Long", limit=precio_salida_arriba, stop=precio_salida_abajo)

// Plot para visualizar la media móvil para el cierre de la operación
plot(sma_cierre, color=color.red)

// Plot para visualizar la SMA de 200
plot(sma_200, color=color.blue)
相关推荐