概述
该策略是一个基于技术分析的交易策略,利用支撑位和阻力位来做出交易决策。策略使用pivothigh()和pivotlow()指标来确定支撑位和阻力位,当收盘价高于阻力位时进行做多,当收盘价低于支撑位且前一个最高价也低于支撑位时进行做空。当价格反向穿过支撑位或阻力位时平仓。该策略适用于俄罗斯股票市场,使用日线数据。
策略原理
- 使用request.security()函数获取日线收盘价数据。
- 使用ta.pivothigh()和ta.pivotlow()函数计算7日时间窗口内的支撑位和阻力位。
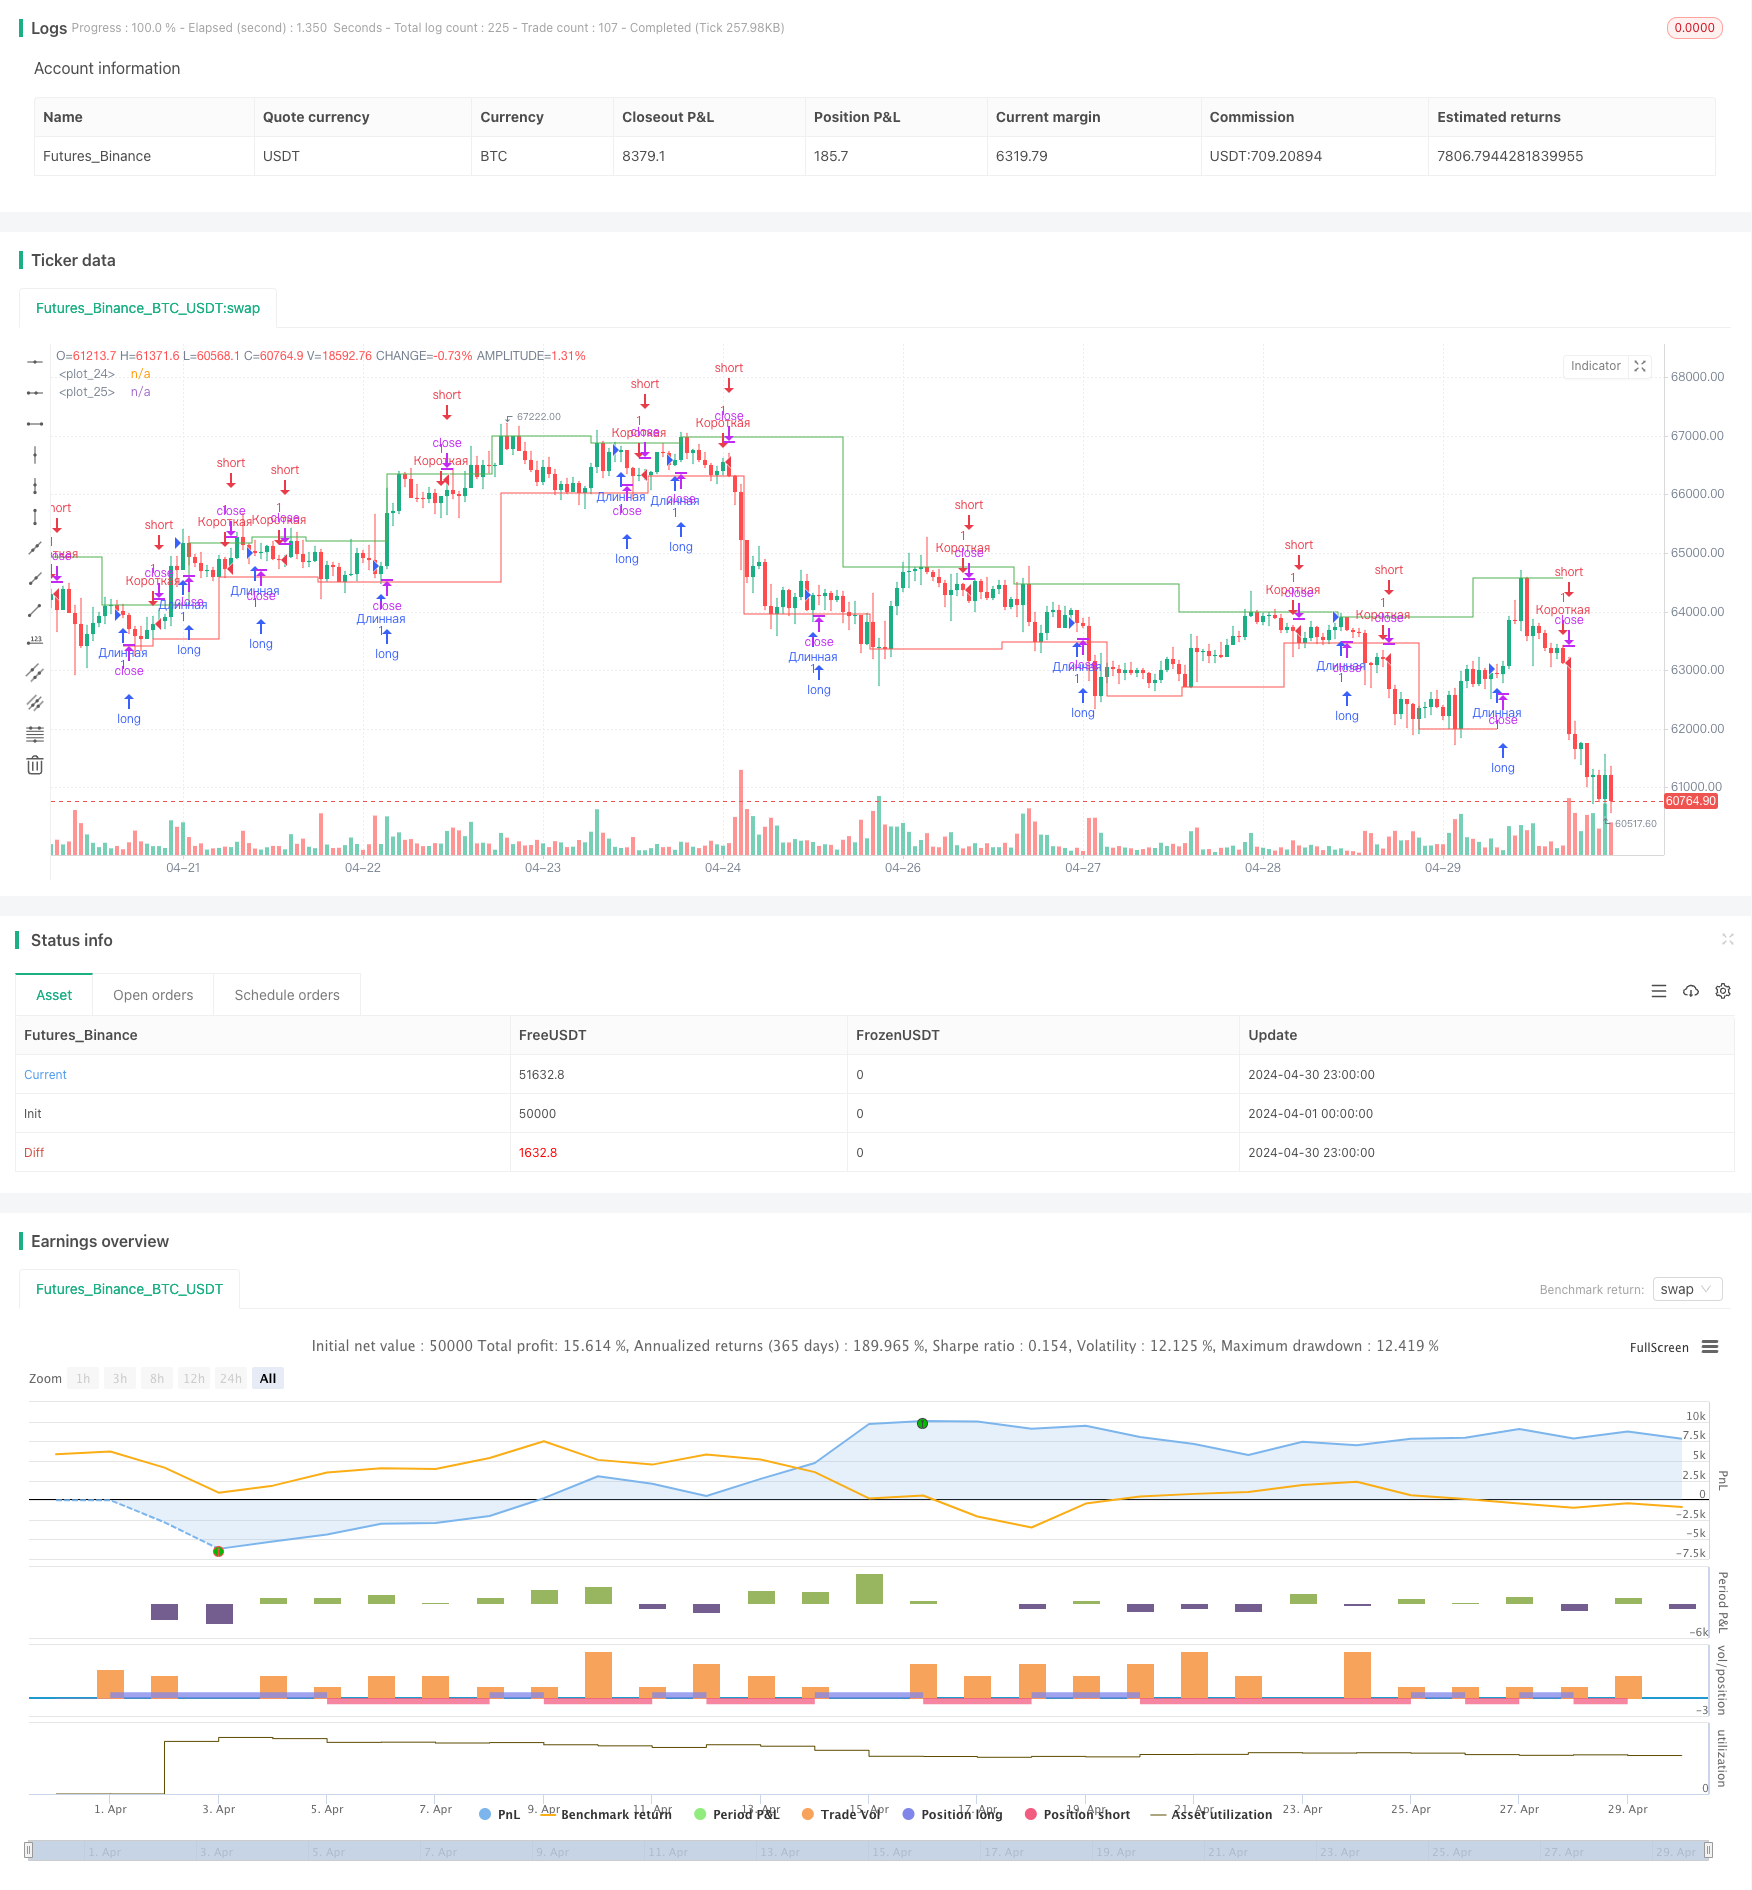
- 当收盘价高于阻力位时,执行做多交易。
- 当收盘价低于支撑位,且前一个最高价也低于支撑位时,执行做空交易。
- 当价格反向穿过支撑位或阻力位时,平仓所有头寸。
- 在图表上绘制支撑位和阻力位,以绿色和红色表示。
策略优势
- 该策略基于技术分析,利用市场价格行为来做出交易决策,适用于趋势性市场。
- 支撑位和阻力位是市场参与者广泛认可的重要价位,策略围绕这些关键价位建立交易信号,有助于捕捉趋势性机会。
- 策略逻辑清晰,易于理解和实现,适合初学者学习和使用。
- 通过图表绘制支撑位和阻力位,可以直观地观察市场结构和价格行为,辅助交易决策。
策略风险
- 该策略完全依赖历史价格数据,在市场出现重大基本面变化或黑天鹅事件时,可能失效。
- 支撑位和阻力位可能被突破,导致策略出现连续亏损。
- 策略缺乏风险管理措施,如止损和头寸规模控制,在市场剧烈波动时可能导致大额亏损。
- 策略在震荡市中表现可能欠佳,频繁交易可能导致高昂的交易成本。
策略优化方向
- 引入趋势确认指标,如移动平均线,以过滤噪音和识别主要趋势,提高信号质量。
- 设置合理的止损位,控制单笔交易风险,提高策略稳健性。
- 优化支撑位和阻力位的计算方法,如采用多时间尺度组合,以提高价位的可靠性。
- 引入仓位管理和资金管理规则,根据市场波动性动态调整头寸规模,控制整体风险敞口。
- 对策略进行参数优化和回测,找到最佳参数组合,提高策略绩效。
总结
该策略是一个基于支撑位和阻力位的技术分析交易策略,通过识别关键价格区域来建立交易信号。策略逻辑清晰,适合初学者学习,但在实际应用中需要注意风险管理和优化。通过引入其他技术指标、风控措施和仓位管理等,可以进一步提升策略的稳健性和盈利能力。在实盘部署前,建议在历史数据上进行全面的回测和参数优化。
策略源码
/*backtest
start: 2024-04-01 00:00:00
end: 2024-04-30 23:59:59
period: 1h
basePeriod: 15m
exchanges: [{"eid":"Futures_Binance","currency":"BTC_USDT"}]
*/

//@version=5
strategy("Торговая стратегия от уровней", overlay=true)

// Функция для определения уровней поддержки и сопротивления
findSR() =>
    // Получаем данные для поиска уровней
    data = request.security(syminfo.tickerid, "D", close)
    // Находим уровни поддержки и сопротивления
    pivot_high = ta.pivothigh(data, 7, 7)
    pivot_low = ta.pivotlow(data, 7, 7)
    [pivot_high, pivot_low]

[support, resistance] = findSR()

// Условия входа в длинную позицию
longCondition = close > resistance
// Условия входа в короткую позицию
shortCondition = close < support and high[1] < support

// Условия выхода из позиции
exitCondition = close < resistance and close > support

// Отображение уровней поддержки и сопротивления на графике
plot(support, color=color.green, style=plot.style_stepline)
plot(resistance, color=color.red, style=plot.style_stepline)

// Вход в позицию
if (longCondition)
    strategy.entry("Длинная", strategy.long)
if (shortCondition)
    strategy.entry("Короткая", strategy.short)

// Выход из позиции
if (exitCondition)
    strategy.close("Длинная")
    strategy.close("Короткая")