EMA, MACD, and RSI Triple Indicator Momentum Strategy

Overview
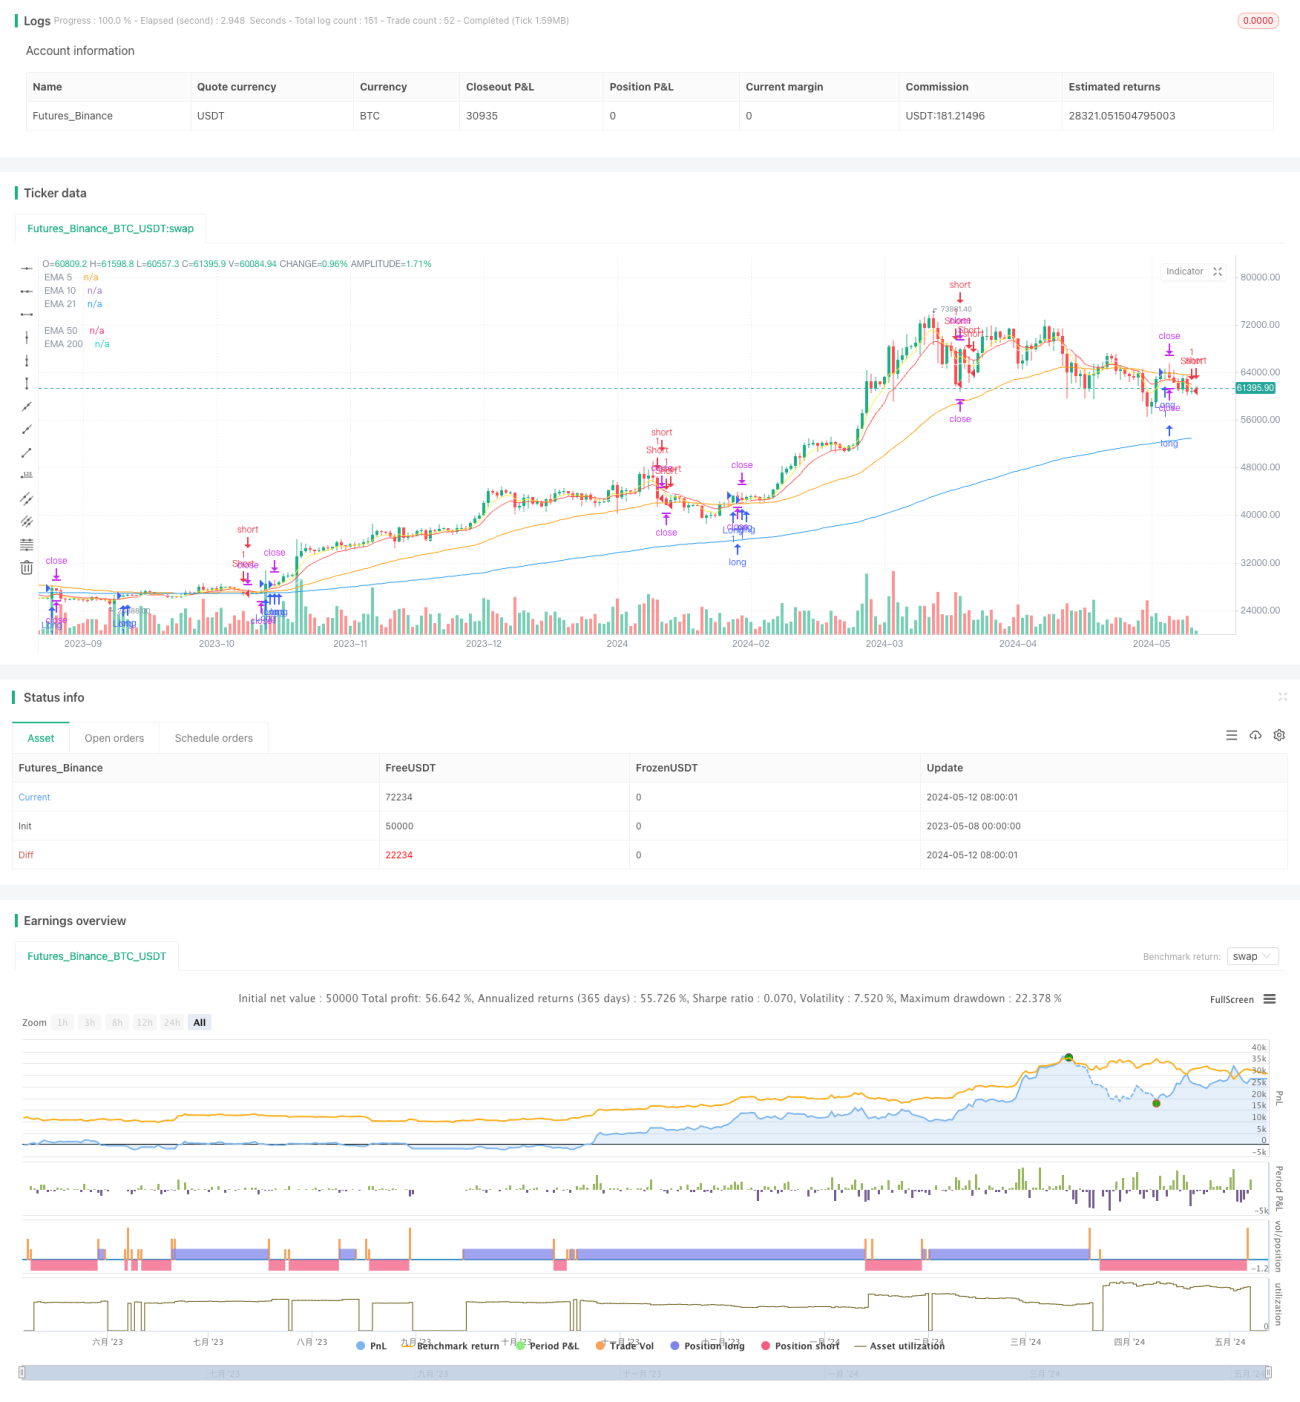
This strategy combines the Exponential Moving Average (EMA), Moving Average Convergence Divergence (MACD), and Relative Strength Index (RSI) to identify potential trend changes and momentum shifts with increased accuracy and reliability. It employs multiple EMAs with different periods (5, 10, 21, 50, 200, and 1000) to comprehensively assess price trends across various time scales. Additionally, the MACD and RSI indicators are used to confirm EMA crossover signals, providing further evidence of trends and momentum.
Strategy Principles
- EMA Crossovers: When a shorter-period EMA (e.g., 9-day) crosses above or below a longer-period EMA (e.g., 21-day), it indicates a potential trend change. A bullish crossover (9-day EMA crossing above 21-day EMA) suggests a bullish trend, while a bearish crossover (9-day EMA crossing below 21-day EMA) suggests a bearish trend.
- MACD Confirmation: MACD signals are used to confirm EMA crossovers. For bullish trades, look for the MACD line crossing above the Signal line and a positive MACD histogram. For bearish trades, look for the opposite. Avoid trading when the MACD histogram is flat or lacks clear direction.
- RSI Confirmation: RSI is used to confirm overbought or oversold conditions in conjunction with EMA and MACD signals. In bullish scenarios, consider taking profits or closing long positions when RSI reaches overbought levels (>70). In bearish scenarios, consider taking profits or closing short positions when RSI reaches oversold levels (<30).
Advantages Analysis
- Multiple Indicator Confirmation: By combining EMA, MACD, and RSI, the strategy provides more comprehensive and reliable trading signals, reducing the likelihood of false signals.
- Trend Following: Using EMAs with different periods helps identify price trends across multiple time scales, capturing the primary market direction.
- Momentum Measurement: MACD and RSI indicators provide additional insights into price momentum, aiding in the assessment of trend strength and potential reversals.
- Risk Management: Setting stop-loss orders and proper position sizing helps manage risk and limit potential losses.
Risk Analysis
- Lagging Nature: As trend-following indicators, EMAs may exhibit some lag, potentially missing early trend changes.
- False Signals: Despite using multiple indicators for confirmation, false signals can still occur, particularly in choppy market conditions.
- Parameter Optimization: The strategy's performance may be sensitive to the choice of indicator parameters, requiring optimization and adaptation to different markets and assets.
- Market Risk: No trading strategy can completely eliminate market risk, and unexpected events or black swan occurrences may lead to significant losses.
Optimization Directions
- Dynamic Parameter Adjustment: Dynamically adjust the parameters of EMAs, MACD, and RSI based on changing market conditions to adapt to different market phases and volatility levels.
- Multi-Timeframe Analysis: Incorporate signals from multiple timeframes, such as daily, 4-hour, and 1-hour charts, to gain a more comprehensive market perspective and confirmation.
- Risk Management Optimization: Optimize stop-loss and take-profit strategies, such as using trailing stops or volatility-based stops, to better protect profits and limit losses.
- Integration of Additional Indicators: Consider incorporating other technical indicators or fundamental factors, such as Bollinger Bands, volume, or market sentiment indicators, to enhance signal quality and reliability.
Summary
The EMA, MACD, and RSI Triple Indicator Momentum Strategy provides a comprehensive approach to trading by leveraging the strengths of multiple technical indicators, enabling traders to identify potential trend changes and momentum shifts with increased confidence. The strategy utilizes EMAs with different periods to assess price trends across multiple time scales and employs MACD and RSI indicators to further confirm trading signals. While the strategy demonstrates advantages, it also carries potential risks such as lagging nature, false signals, and market risk. Through dynamic parameter adjustment, multi-timeframe analysis, risk management optimization, and the integration of additional indicators, the strategy's performance and robustness can be further enhanced. However, any trading strategy should undergo thorough backtesting and evaluation before implementation and be adapted to suit individual trading styles and risk tolerance.
- 1