Short-Term Trading Strategy Based on Bollinger Bands, Moving Average, and RSI

Overview
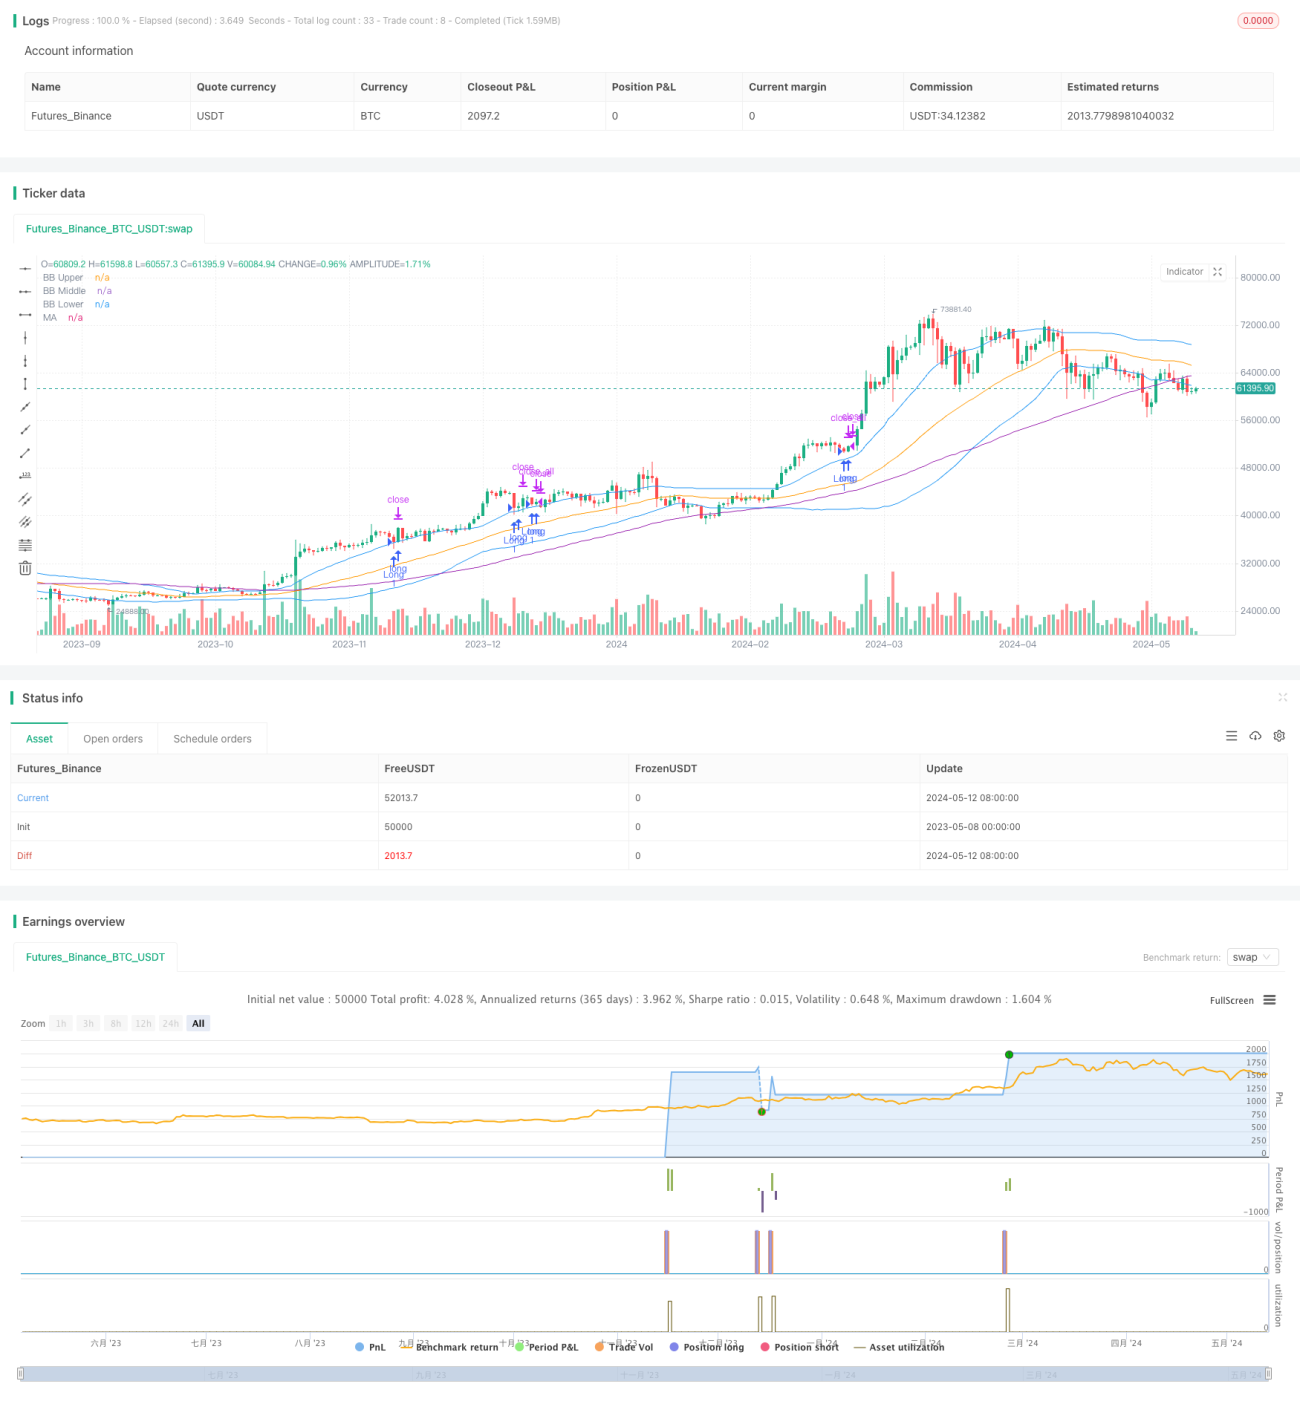
This strategy aims to capture short-term price movements by utilizing a combination of Bollinger Bands (BB), Moving Average (MA), and Relative Strength Index (RSI) for long trading. The strategy enters long positions when the price is above the upper band and moving average, and the RSI indicates an oversold condition. It manages risk and locks in profits through percentage-based stop loss and take profit levels, and adjusts entry prices based on the trader's Bybit account level to account for commissions.
Strategy Principles
The strategy is based on the following principles:
- Bollinger Bands: When the price breaks above the upper band, it suggests a potential uptrend in the market.
- Moving Average: A price above the moving average indicates a current uptrend.
- Relative Strength Index: When the RSI is below the oversold threshold, it suggests a potential market reversal and price increase.
By combining these three indicators, the strategy identifies potential long entry opportunities when the price breaks above the upper Bollinger Band, is above the moving average, and the RSI is in the oversold region. It also sets stop loss and take profit prices to control risk and lock in profits.
Strategy Advantages
- Multiple indicators: The strategy considers Bollinger Bands, Moving Average, and RSI, providing a more comprehensive market analysis.
- Trend following: By using Bollinger Bands and Moving Average, the strategy can identify the current market trend.
- Oversold signals: The RSI indicator helps identify potential oversold conditions and catch potential reversal opportunities.
- Risk management: The strategy incorporates percentage-based stop loss and take profit levels to control risk and lock in profits.
- Commission consideration: It adjusts entry prices based on the trader's Bybit account level to account for commissions.
Strategy Risks
- False signals: Any technical indicator can generate false signals, leading to unnecessary trades.
- Market volatility: The market may experience severe short-term fluctuations, triggering stop losses or missing potential profits.
- Trend reversal: The strategy assumes the current trend will continue, but trends can suddenly reverse, resulting in losses.
- Commission impact: Although the strategy accounts for commissions, frequent trading can still increase commission costs, affecting overall profitability.
Strategy Optimization Directions
- Parameter optimization: Optimize the parameters for Bollinger Bands, Moving Average, and RSI to adapt to different market conditions.
- Long and short combination: Consider adding short trading conditions to fully utilize different market opportunities.
- Dynamic stop loss and take profit: Adjust stop loss and take profit levels dynamically based on market volatility to better control risk and lock in profits.
- Combining other indicators: Introduce other technical indicators, such as MACD, ATR, etc., to enhance the strategy's reliability.
- Money management: Optimize money management methods, such as adjusting position sizes based on risk, to improve risk-adjusted returns.
Summary
This strategy utilizes a combination of Bollinger Bands, Moving Average, and RSI to identify short-term long trading opportunities. It determines trends using Bollinger Bands and Moving Average, identifies oversold conditions with RSI, and sets stop loss and take profit levels to manage risk. The strategy considers commission impact and adjusts based on the trader's Bybit account level. While the strategy has certain advantages, it still faces risks such as false signals, market volatility, and trend reversals. Future optimizations can include parameter optimization, combining long and short positions, dynamic stop loss and take profit, incorporating other indicators, and optimizing money management to improve the strategy's performance and adaptability.
- 1