概述
该策略是一个基于布林带和移动平均线的趋势交易策略。通过比较简单移动平均线(SMA)和指数移动平均线(EMA)的大小关系,来判断当前的趋势方向。当收盘价上穿较大的移动平均线时,产生买入信号;当收盘价下穿较小的移动平均线时,产生卖出信号。该策略试图捕捉市场的主要趋势,并在趋势反转时及时平仓,以获取趋势行情的利润。
策略原理
- 计算20日简单移动平均线(SMA)和21日指数移动平均线(EMA)。
- 比较SMA和EMA的大小,将较大的定义为bmsbmayor,较小的定义为bmsbmenor,分别代表多头和空头趋势的参考线。
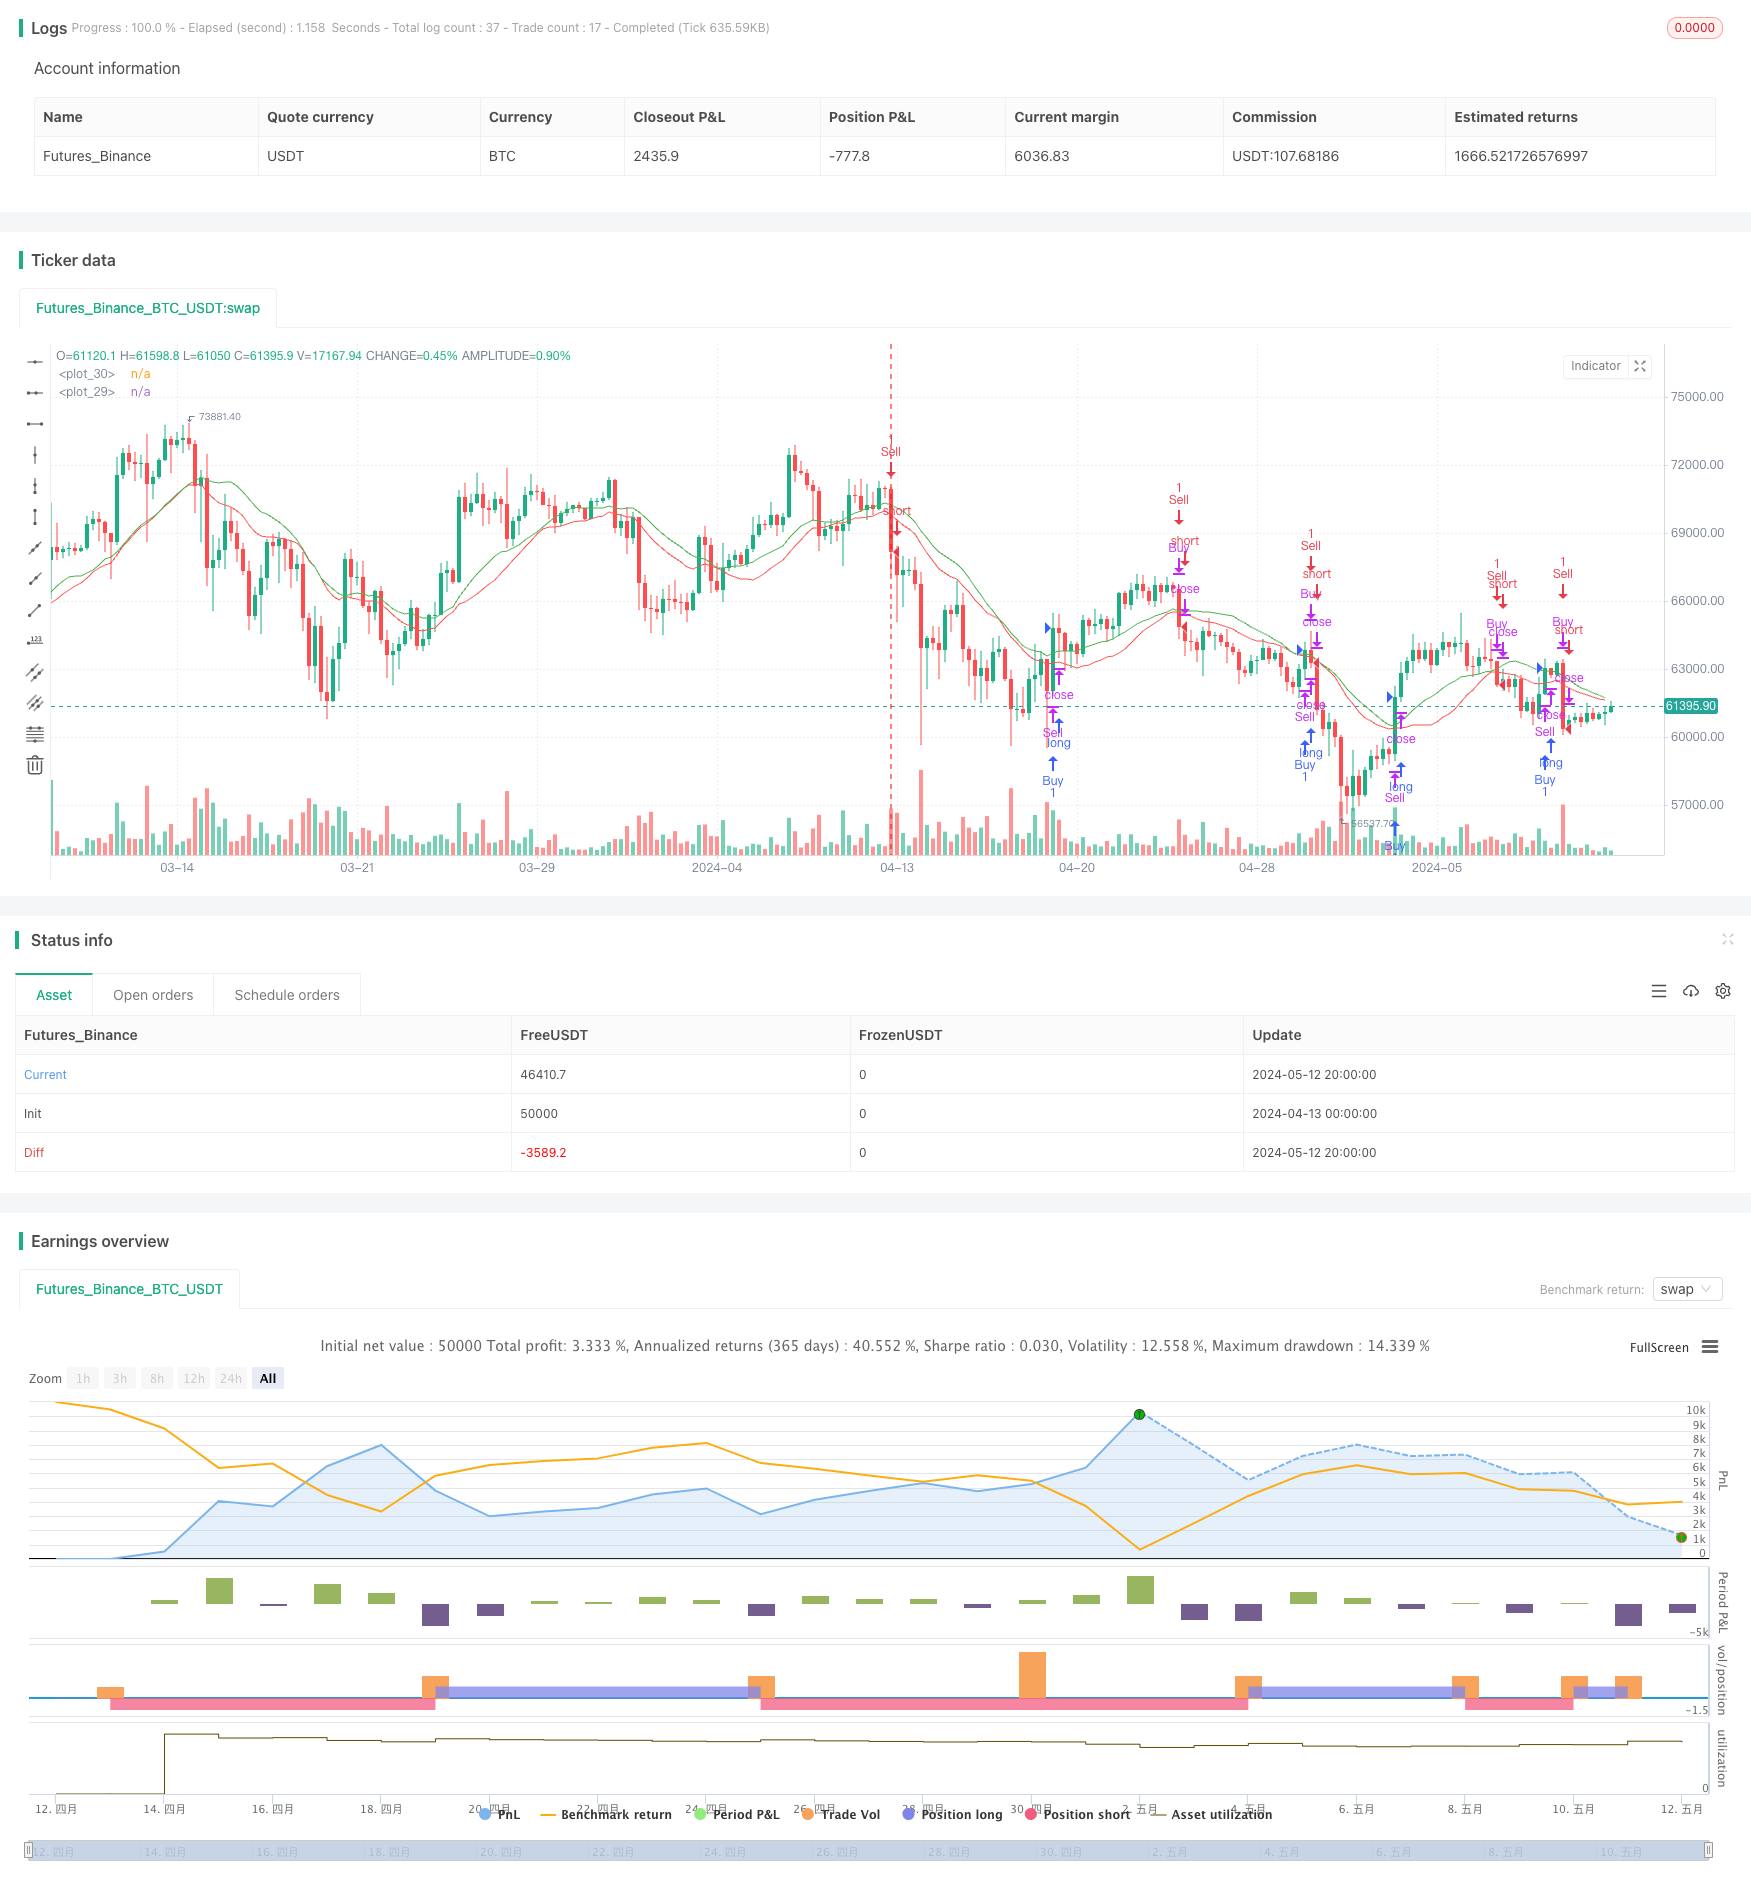
- 当收盘价上穿bmsbmayor时,产生买入信号;如果当前持有空头仓位,先平空,再开多。
- 当收盘价下穿bmsbmenor时,产生卖出信号;如果当前持有多头仓位,先平多,再开空。
- 在图表上绘制bmsbmayor和bmsbmenor,分别用绿色和红色表示,直观显示多空趋势参考线。
策略优势
- 简单易懂:该策略逻辑清晰,使用了最常见的移动平均线指标,容易理解和实现。
- 趋势跟踪:通过比较两条移动平均线的大小,可以有效判断当前的趋势方向,顺应主要趋势进行交易。
- 自适应性:由于使用了指数移动平均线,对价格变化的反应更加灵敏,能够更好地适应市场节奏的变化。
- 及时止损:在趋势反转时,及时平掉原有仓位,避免了持有亏损头寸过久,减小了潜在损失。
- 视觉友好:在图表上绘制多空趋势参考线,使得趋势判断更加直观,便于交易决策。
策略风险
- 参数优化:移动平均线的周期选择对策略表现有较大影响,不同市场和品种可能需要不同的参数设置,需要进行参数优化和回测。
- 震荡市:在震荡市场中,该策略可能产生较多的虚假信号,导致频繁交易和资金损耗。
- 趋势延迟:移动平均线是滞后指标,在趋势初期和末期可能出现信号延迟,错过最佳入场和出场时机。
- 黑天鹅事件:该策略主要基于历史价格数据,对于一些突发的重大事件和极端行情,可能无法及时应对。
策略优化方向
- 引入更多指标:在移动平均线的基础上,可以引入其他技术指标如RSI、MACD等,综合多个指标的信号,提高趋势判断的准确性。
- 动态调整参数:根据市场波动性和行情特点,动态调整移动平均线的周期和其他参数,使策略更加适应市场变化。
- 加入止损止盈:设置合理的止损止盈位,控制单笔交易的风险敞口,提高风险收益比。
- 仓位管理:根据趋势强度和信号可信度,动态调整仓位大小,在趋势强度大时加大仓位,在趋势不明朗时减小仓位。
- 结合基本面分析:将技术分析与基本面分析相结合,在趋势判断的基础上,考虑宏观经济、行业发展等因素,做出更全面的交易决策。
总结
BMSB布林麦克超级趋势交易策略是一个简单实用的趋势跟踪策略,通过比较两条移动平均线的大小来判断多空趋势,在趋势行情中能够取得不错的效果。但是该策略也存在一些局限性,如在震荡市中表现不佳,信号延迟等问题。因此,在实际应用中,可以考虑引入更多指标、优化参数、加强风险管理等方面进行改进,以提高策略的稳定性和盈利能力。同时,也要注意结合基本面分析,对市场进行全面的研判,作出更加合理的交易决策。
策略源码
/*backtest
start: 2024-04-13 00:00:00
end: 2024-05-13 00:00:00
period: 6h
basePeriod: 15m
exchanges: [{"eid":"Futures_Binance","currency":"BTC_USDT"}]
*/

//@version=5
strategy("BMSB Strategy Mejora", overlay=true)

// Indicators
src = close
sma = ta.sma(src, 20)
ema = ta.ema(src, 21)

// Bull Super Market as var
bmsbmayor = sma > ema ? sma : ema
bmsbmenor = sma > ema ? ema : sma

// Buy and Sell conditions
buySignal = ta.crossover(close, bmsbmayor)
sellSignal = ta.crossunder(close, bmsbmenor)

// Buy and Sell orders
if (buySignal)
    if (strategy.position_size < 0)
        strategy.close("Sell")
    strategy.entry("Buy", strategy.long)

if (sellSignal)
    if (strategy.position_size > 0)
        strategy.close("Buy")
    strategy.entry("Sell", strategy.short)

// Plot
plot(bmsbmayor, color=color.green)
plot(bmsbmenor, color=color.red)
相关推荐