资源加载中... loading...

Relative Strength Index Mean Reversion Strategy

Author: ChaoZhang, Date: 2024-05-14 16:01:29
Tags: RSISMA

img

Overview

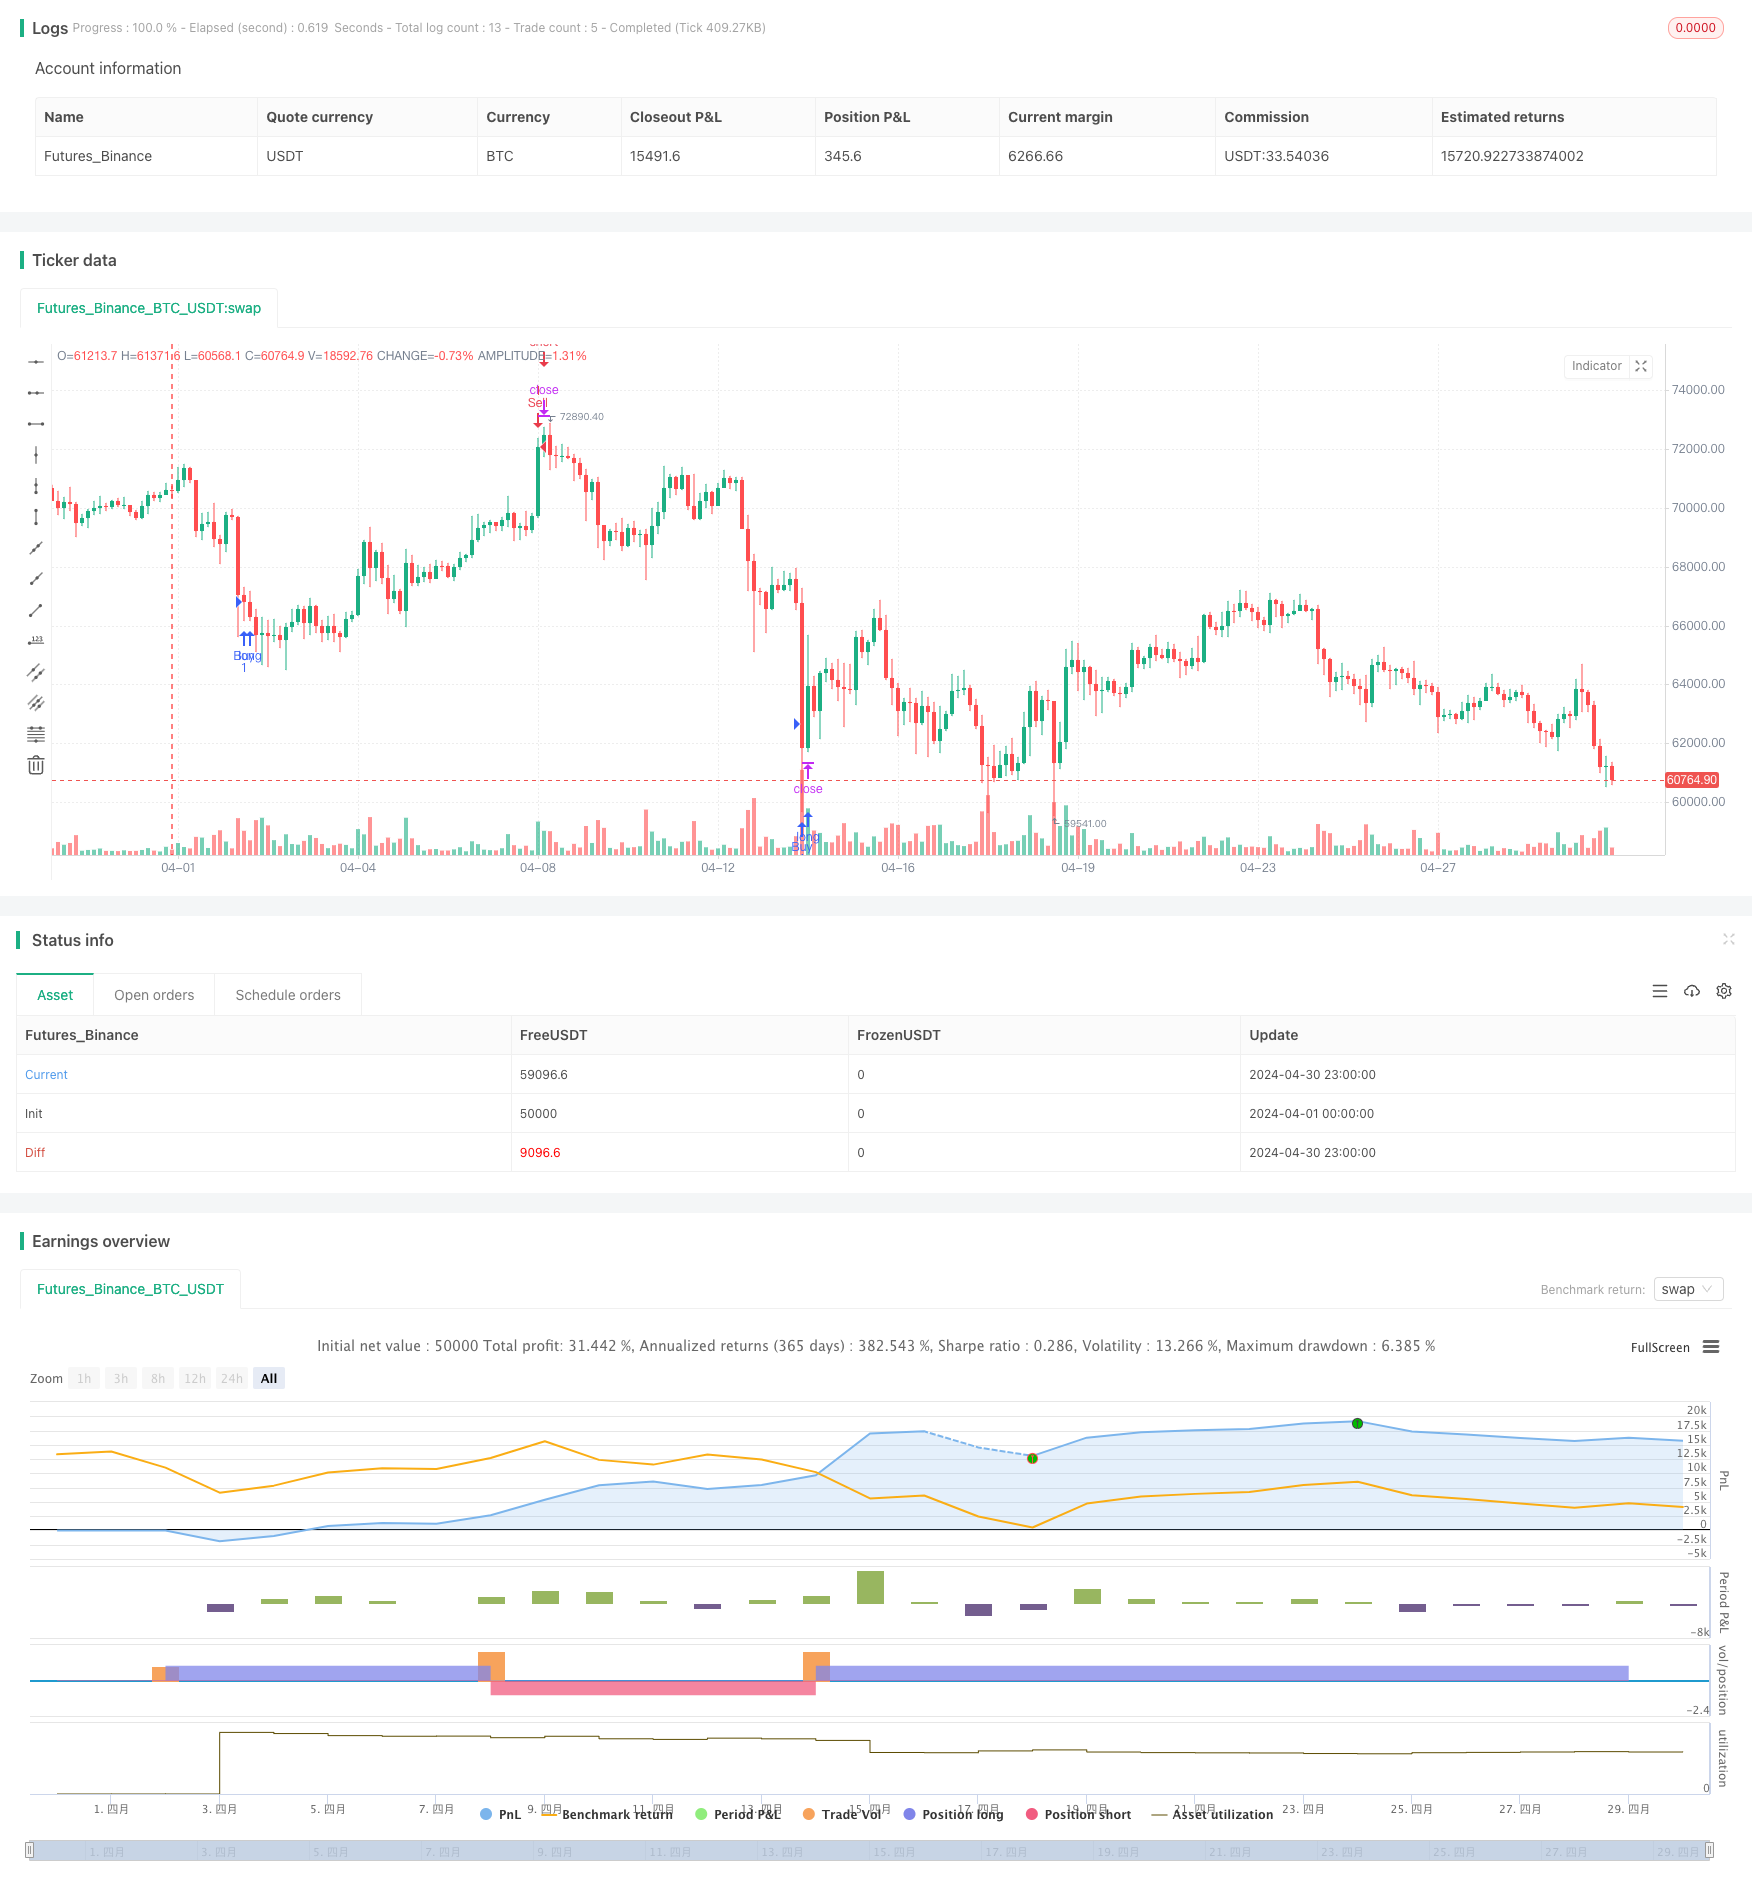
This strategy utilizes the Relative Strength Index (RSI) and Simple Moving Average (SMA) to identify potential mean reversion opportunities in the market. When the RSI is below the buy threshold and the price is below the SMA, a buy signal is generated. When the RSI is above the sell threshold and the price is above the SMA, a sell signal is generated. The strategy also sets stop loss and profit target levels to manage trading risks and lock in profits.

Strategy Principle

The core principle of this strategy is the concept of mean reversion, which suggests that prices tend to revert back to their average levels after reaching extreme levels. By using the RSI indicator to measure overbought and oversold conditions and combining it with the SMA as a reference benchmark for price, the strategy aims to capture reversion opportunities when prices deviate too far from their mean.

Specifically, the strategy follows these steps:

  1. Calculate the RSI and SMA indicators.
  2. Check if the buy conditions are met: RSI below the buy threshold (default 30) and price below the SMA.
  3. Check if the sell conditions are met: RSI above the sell threshold (default 70) and price above the SMA.
  4. If a long position is held, calculate the stop loss and take profit levels. If the price reaches either level, close the position.
  5. If a buy signal is met, enter a long position. If a sell signal is met, enter a short position.

Strategy Advantages

  1. Mean reversion strategies can capture reversal opportunities when prices deviate too far from their mean, potentially generating profits.
  2. Using the RSI indicator can effectively identify overbought and oversold conditions, improving the reliability of trading signals.
  3. Combining the SMA as a price benchmark can filter out some noise signals and enhance the quality of trades.
  4. Setting stop loss and profit target levels can effectively manage trading risks and protect account funds.

Strategy Risks

  1. Mean reversion strategies may not perform well in trending markets, as prices may continue to deviate from the mean without reverting.
  2. The choice of RSI and SMA parameters can impact strategy performance, and improper parameter settings may lead to false signals and losses.
  3. Fixed percentage stop loss and profit targets may not adapt well to different market volatility conditions, leading to premature stops or insufficient profit maximization.

Strategy Optimization Directions

  1. Consider using adaptive stop loss and profit taking methods, such as dynamic stops based on Average True Range (ATR), to better adapt to market volatility.
  2. Experiment with different combinations of RSI and SMA parameters and find the optimal settings through backtesting and optimization.
  3. Incorporate additional technical indicators or market sentiment indicators to improve the reliability and robustness of trading signals.
  4. Introduce position sizing and risk control measures, such as risk-based position adjustments or dynamic weight allocation, to optimize the risk-reward characteristics of the strategy.

Summary

This Relative Strength Index Mean Reversion strategy leverages RSI and SMA to capture reversion opportunities when prices deviate from their mean. It has advantages such as simplicity, ease of understanding, and adaptability. However, it may underperform in trending markets and relies on parameter selection. By optimizing stop loss and profit taking methods, parameter settings, incorporating additional indicators, and implementing risk management measures, the robustness and profitability potential of this strategy can be further enhanced.


/*backtest
start: 2024-04-01 00:00:00
end: 2024-04-30 23:59:59
period: 3h
basePeriod: 15m
exchanges: [{"eid":"Futures_Binance","currency":"BTC_USDT"}]
*/

//@version=5
strategy('Mean Reversion with Tight Stop Loss', overlay=true)

// Define parameters
rsiLength = 14
rsiThresholdBuy = 30
rsiThresholdSell = 70
smaPeriod = 20
stopLossPercentage = 0.5  // 0.5% stop loss
profitTargetPercentage = 1  // 1% profit target

// Calculate indicators
rsi = ta.rsi(close, rsiLength)
sma = ta.sma(close, smaPeriod)

// Entry conditions
buySignal = rsi < rsiThresholdBuy and close < sma
sellSignal = rsi > rsiThresholdSell and close > sma

// Exit conditions
if strategy.position_size > 0
    stopLoss = strategy.position_avg_price * (1 - stopLossPercentage / 100)
    takeProfit = strategy.position_avg_price * (1 + profitTargetPercentage / 100)

    if close <= stopLoss or close >= takeProfit
        strategy.close('Exit', comment='Stop Loss / Take Profit')

// Execute trades
if buySignal
    strategy.entry('Buy', strategy.long)

if sellSignal
    strategy.entry('Sell', strategy.short)


template: strategy.tpl:40:21: executing "strategy.tpl" at <.api.GetStrategyListByName>: wrong number of args for GetStrategyListByName: want 7 got 6