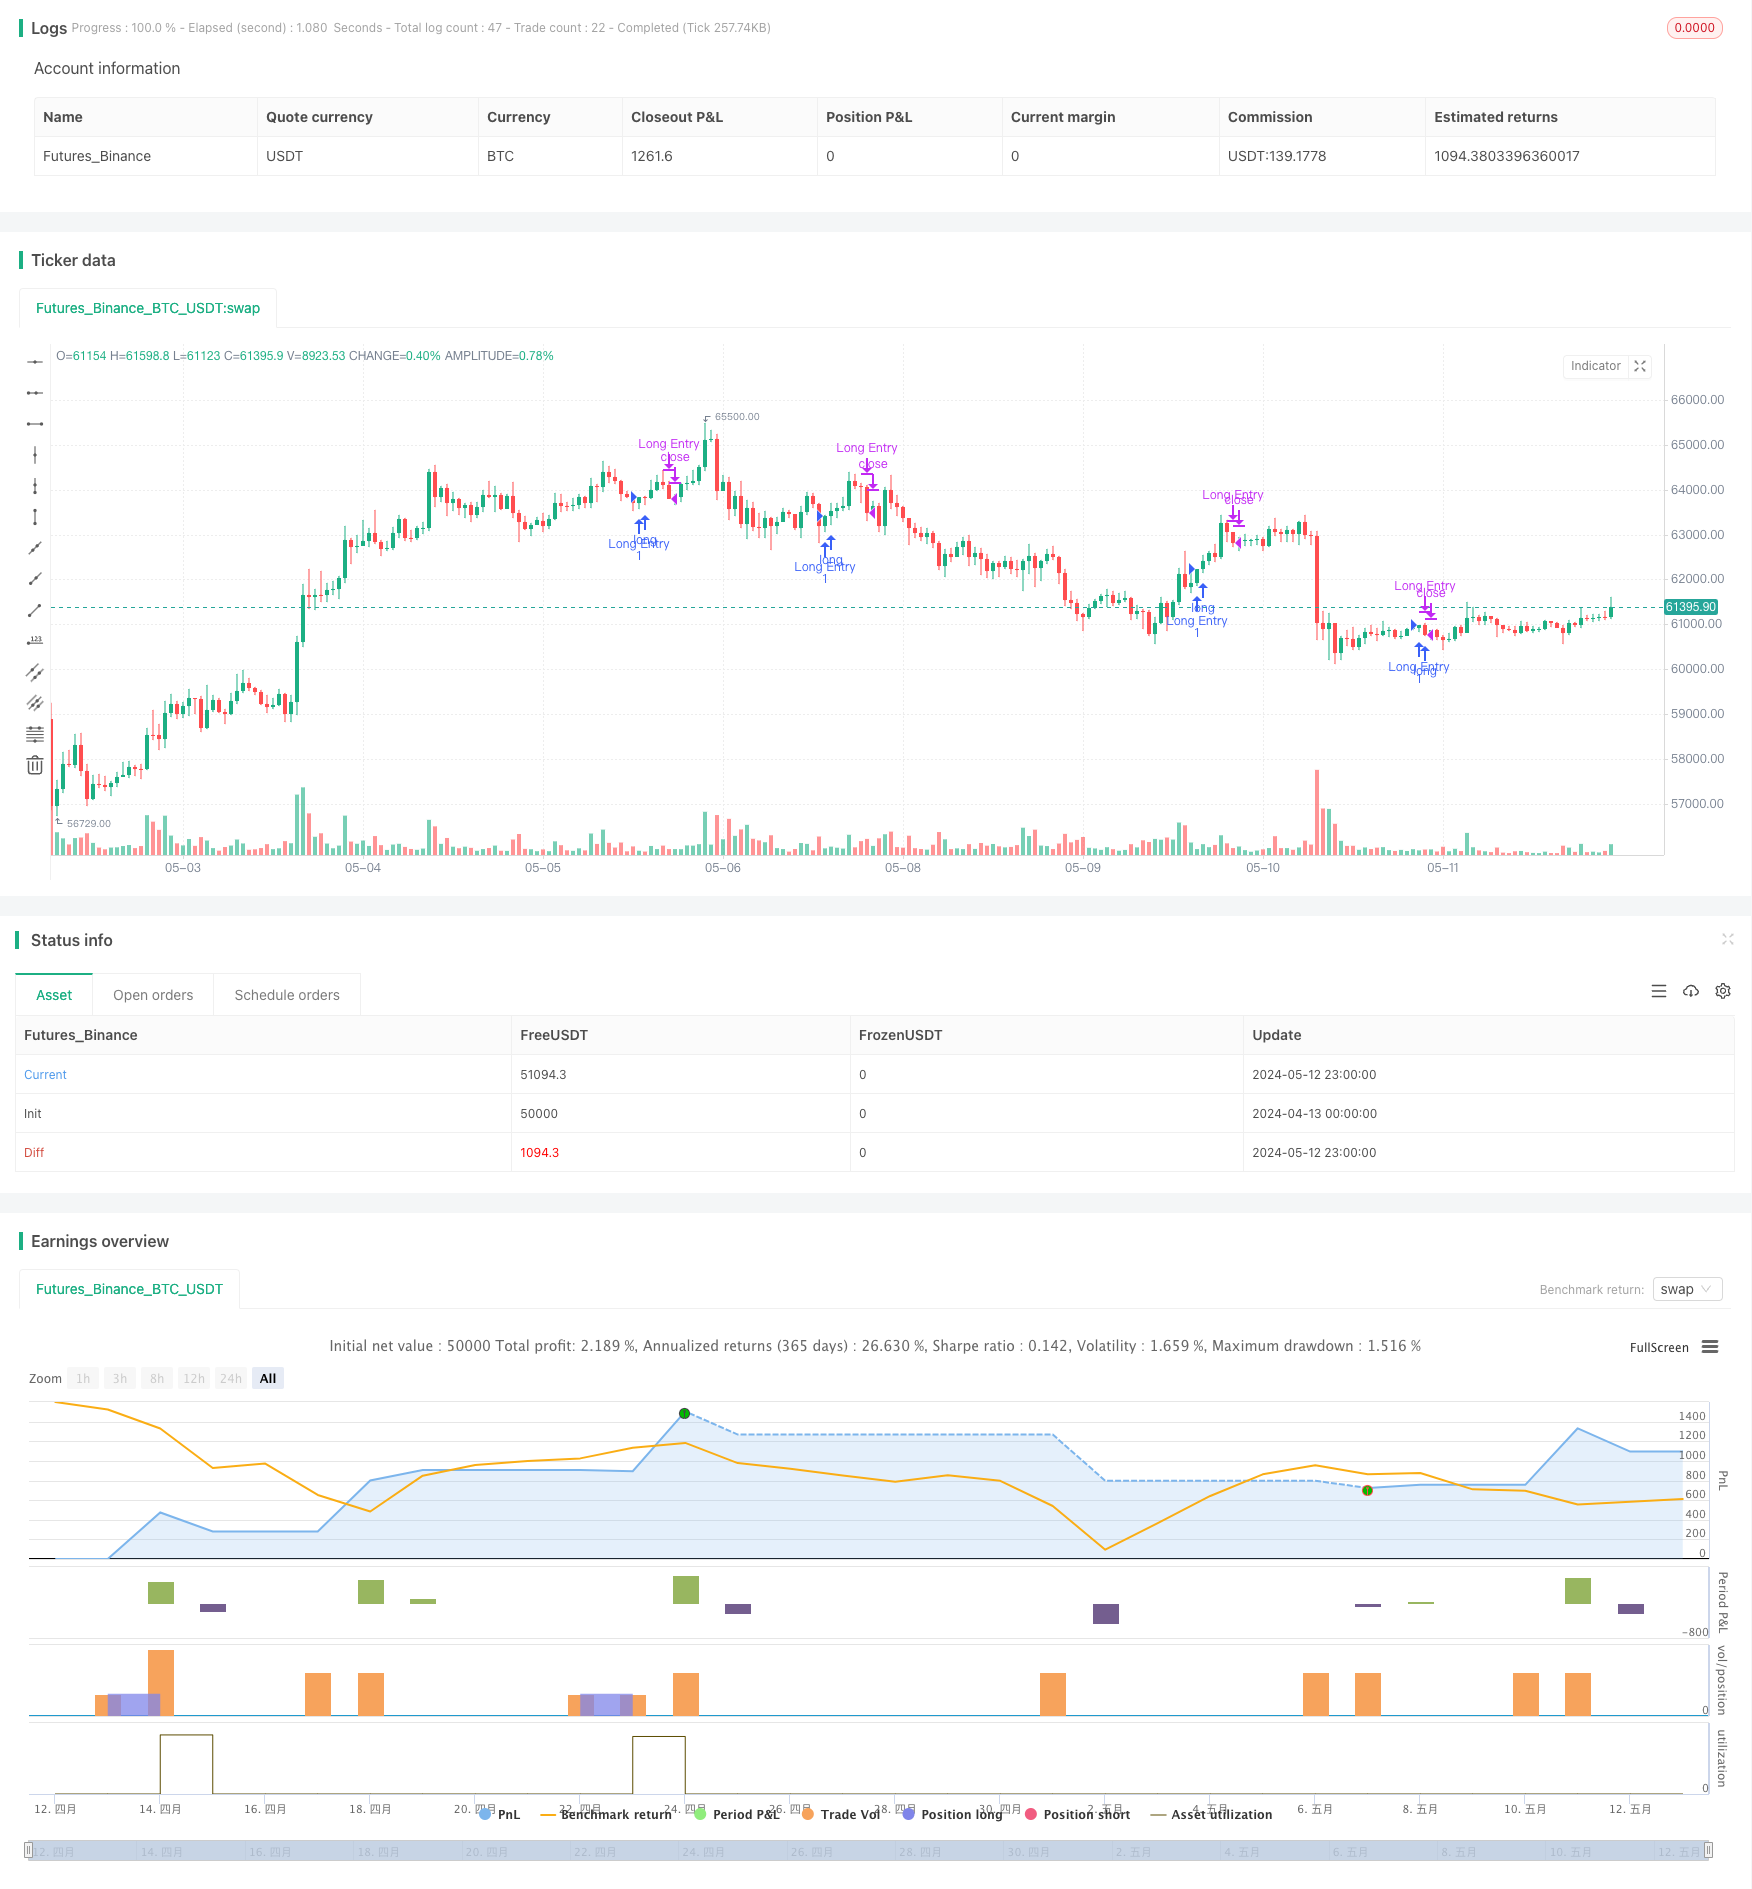
概述
该策略主要思路是寻找没有上引线的看涨K线作为买入信号,并在价格跌破前一根K线低点时平仓。该策略利用了看涨K线上引线很小这一特征,表明多方力量强劲,股价继续上涨的概率较大。同时,前一根K线低点作为止损位,可以有效控制风险。
策略原理
- 判断当前K线是否为看涨K线(收盘价高于开盘价)
- 计算当前K线上引线长度占K线实体长度的比例
- 如果上引线比例小于5%,则认为是有效的无上引线看涨K线,发出买入信号
- 记录买入后前一根K线的最低价作为止损位
- 当价格跌破止损位时,平仓退出
策略优势
- 选择无上引线的看涨K线入场,趋势强度更大,成功率更高
- 利用前一根K线低点作为止损位,风险可控
- 逻辑简单,容易实现和优化
- 适合在趋势行情中使用
策略风险
- 可能出现买入信号后即刻回撤触发止损的情况
- 对于高波动率的品种,止损位可能设置过于靠近买入价,导致过早止损
- 缺乏盈利目标,难以把握最佳平仓时机
策略优化方向
- 可以结合其他指标如MA、MACD等,对趋势强度进行确认,提高入场信号有效性
- 对于高波动品种,可以将止损位设置在更远的位置,如前N根K线的最低点,减少止损频率
- 引入盈利目标,如N倍ATR或百分比获利等,及时锁定利润
- 考虑加入仓位管理,如根据信号强度调整仓位大小等
总结
该策略通过选取无上引线的看涨K线入场,利用前一根K线低点止损,可在趋势行情中有效捕捉利润。但策略也存在一定局限性,如止损位置不够灵活,缺乏盈利目标等。可通过引入其他指标过滤信号、优化止损位置和设置盈利目标等方式进行改进,使策略更加稳健有效。
Overview
The main idea of this strategy is to find bullish candles without upper wicks as buy signals and close positions when the price breaks below the low of the previous candle. The strategy utilizes the characteristic of bullish candles with very small upper wicks, indicating strong bullish momentum and a higher probability of continued price increases. At the same time, using the low of the previous candle as a stop-loss level can effectively control risk.
Strategy Principles
- Determine if the current candle is a bullish candle (close price higher than open price)
- Calculate the ratio of the current candle’s upper wick length to its body length
- If the upper wick ratio is less than 5%, consider it a valid bullish candle without an upper wick and generate a buy signal
- Record the lowest price of the previous candle after buying as the stop-loss level
- When the price breaks below the stop-loss level, close the position and exit
Strategy Advantages
- Selecting bullish candles without upper wicks for entry, the trend strength is greater and the success rate is higher
- Using the low of the previous candle as the stop-loss level, risks are controllable
- Simple logic, easy to implement and optimize
- Suitable for use in trending markets
Strategy Risks
- There may be cases where a buy signal is followed by an immediate pullback triggering the stop-loss
- For highly volatile instruments, the stop-loss level may be set too close to the buy price, leading to premature stop-outs
- Lack of profit targets, making it difficult to grasp the optimal exit timing
Strategy Optimization Directions
- Combine with other indicators such as MA, MACD, etc., to confirm trend strength and improve the effectiveness of entry signals
- For highly volatile instruments, set the stop-loss level at a further position, such as the lowest point of the previous N candles, to reduce the stop-loss frequency
- Introduce profit targets, such as N times ATR or percentage gains, to lock in profits in a timely manner
- Consider adding position management, such as adjusting position size based on signal strength
Summary
This strategy captures profits effectively in trending markets by selecting bullish candles without upper wicks for entry and using the low of the previous candle for stop-loss. However, the strategy also has certain limitations, such as inflexible stop-loss placement and lack of profit targets. Improvements can be made by introducing other indicators to filter signals, optimizing stop-loss positions, and setting profit targets to make the strategy more robust and effective.
/*backtest
start: 2024-04-13 00:00:00
end: 2024-05-13 00:00:00
period: 1h
basePeriod: 15m
exchanges: [{"eid":"Futures_Binance","currency":"BTC_USDT"}]
*/

// This Pine Script™ code is subject to the terms of the Mozilla Public License 2.0 at https://mozilla.org/MPL/2.0/
// © nagpha

//@version=5
strategy("My strategy", overlay=true, margin_long=100, margin_short=100)

candleBodySize = math.abs(open - close)

// Calculate candle wick size
candleWickSize = high - close

// Calculate percentage of wick to candle body
wickPercentage = (candleWickSize / candleBodySize) * 100

// Check if candle is bullish and wick is less than 1% of the body
isBullish = close > open
isWickLessThan5Percent = wickPercentage < 5


longCondition = isBullish and isWickLessThan5Percent

if (longCondition)
    // log.info("long position taken")
    strategy.entry("Long Entry", strategy.long)

float prevLow = 0.0
prevLow := request.security(syminfo.tickerid, timeframe.period, low[1], lookahead=barmerge.lookahead_on)

float closingPrice = close
//plot(closingPrice, "Close Price", color.purple, 3)
//plot(prevLow, "Previous Low", color.red, 3)
//log.info("Outside: {0,number,#}",closingPrice)
//log.info("Outside: {0,number,#}",prevLow)

if closingPrice < prevLow and strategy.position_size > 0
    //log.info("inside close: {0,number} : {0,number}",closingPrice,prevLow)
    // log.info("position exited")
    strategy.close("Long Entry")
    longCondition := false
    prevLow := 0
    isBullish := false

//plot(series=strategy.position_size > 0 ? prevLow : na, color = color.new(#40ccfb,0), style=plot.style_cross,linewidth = 5)