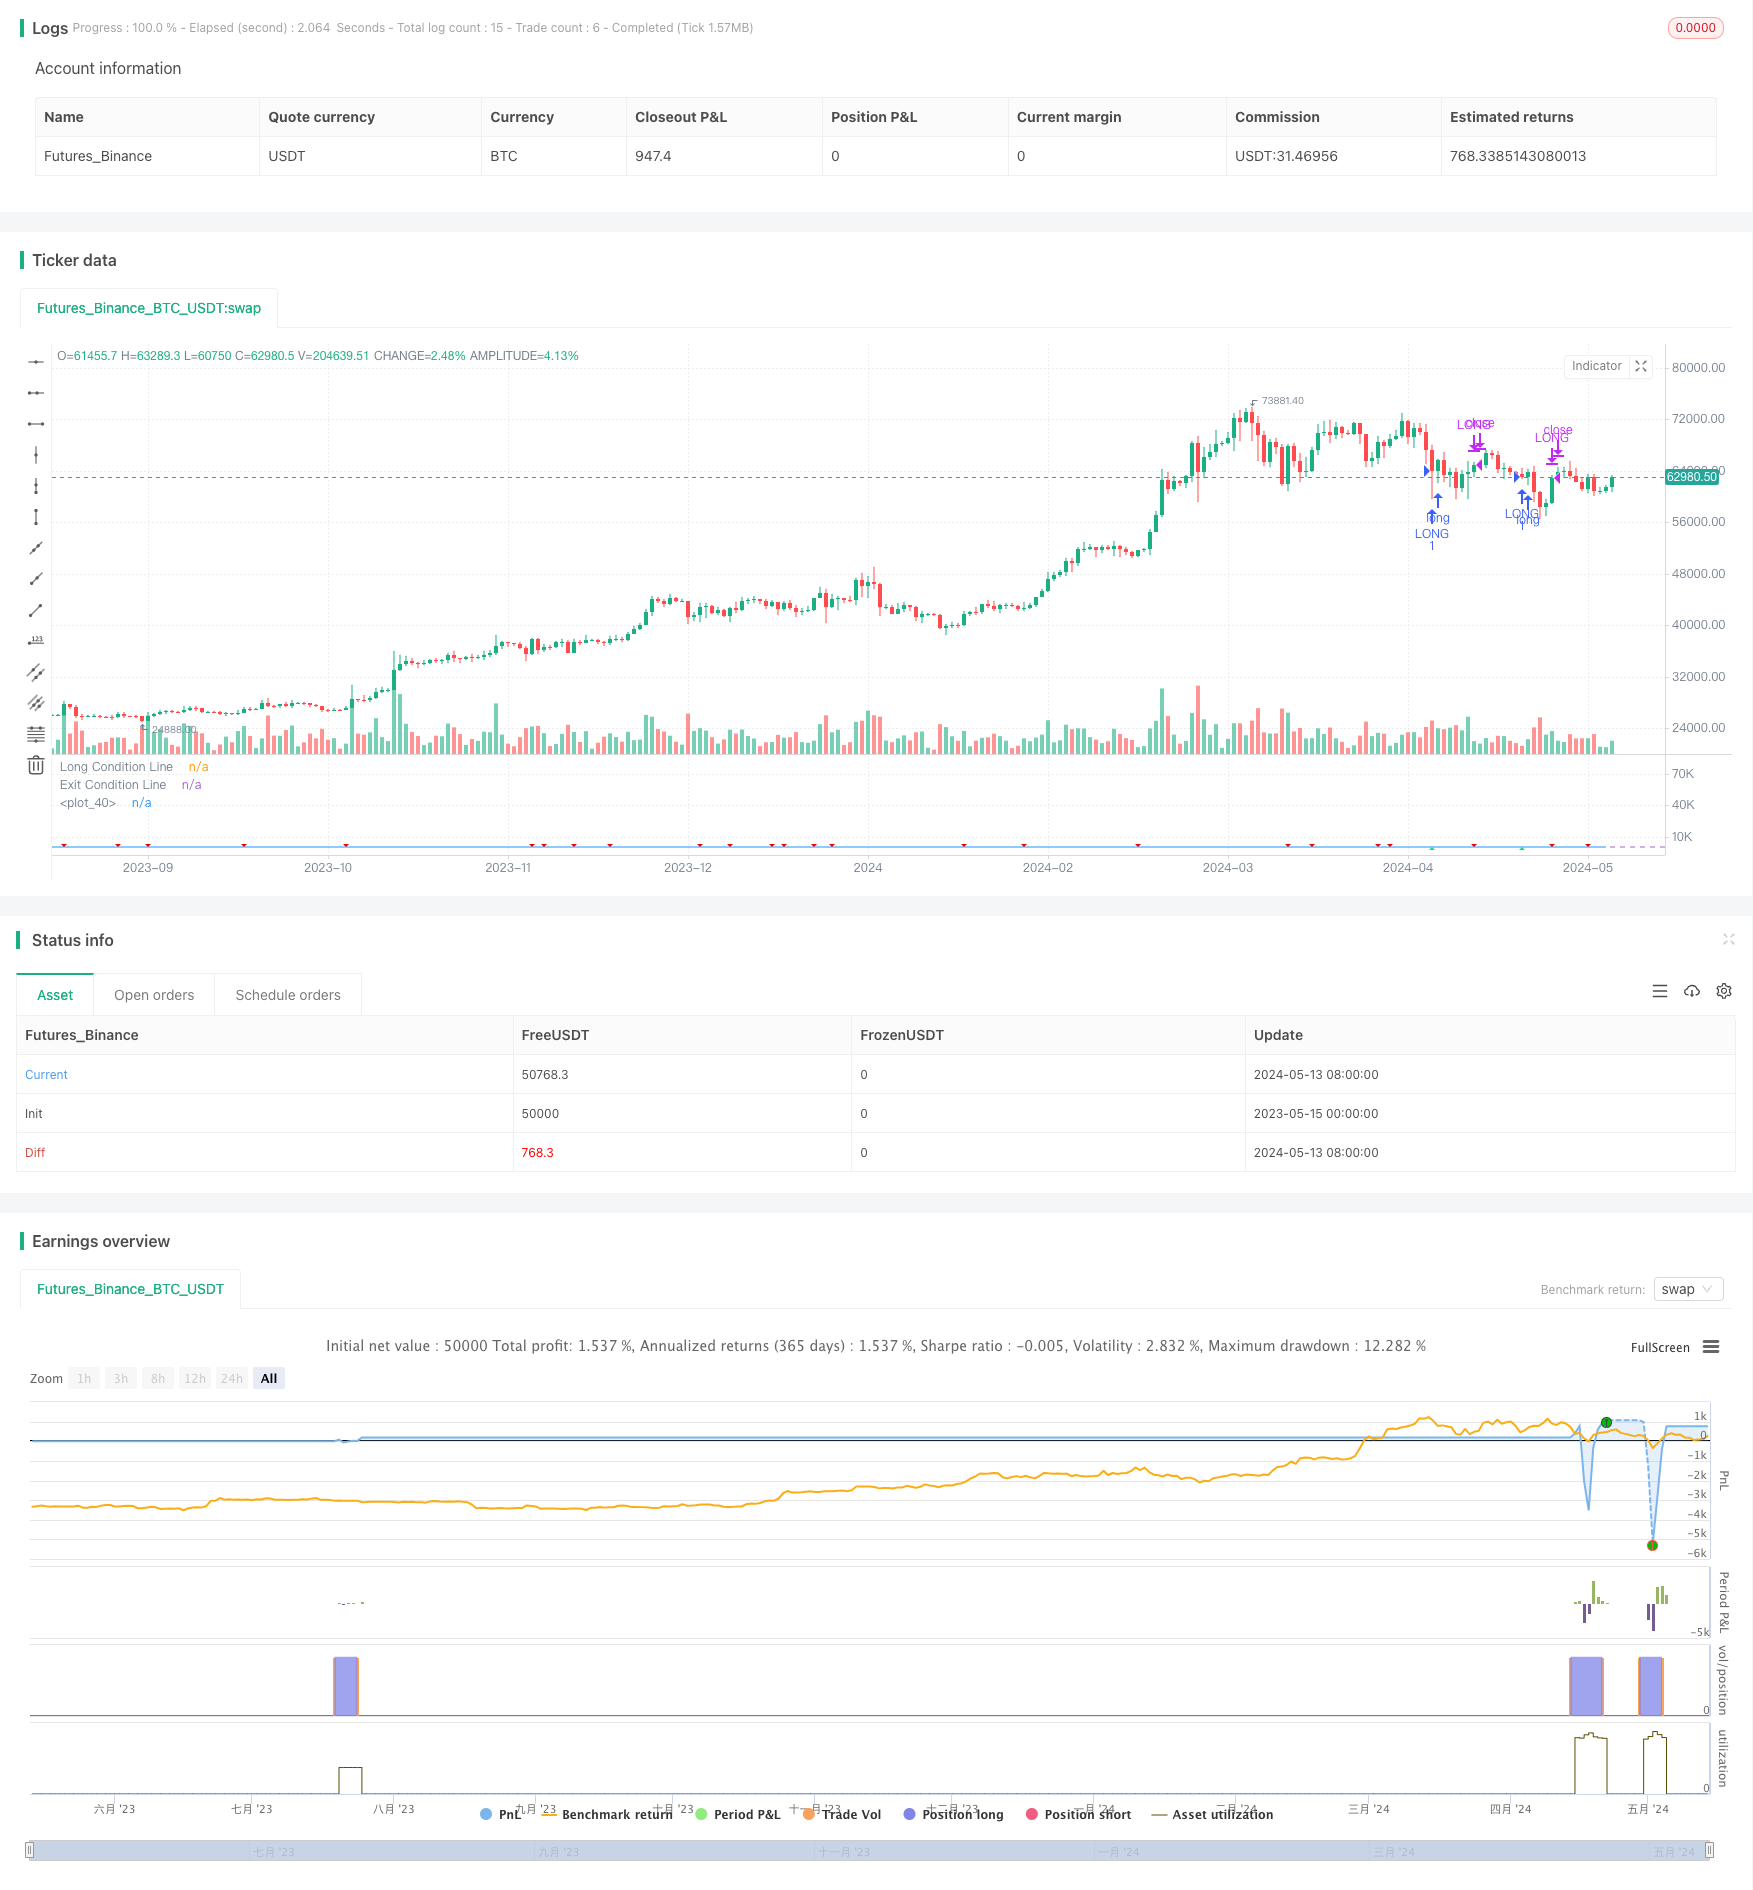
概述
该策略主要利用相对强弱指数(RSI)来判断市场超买超卖情况,结合价格在200日简单移动平均线(SMA)之上作为趋势过滤条件,以此来决定是否进场交易。该策略通过三重RSI指标共同构建开仓条件,只有当短期RSI小于35且连续三个周期呈下降趋势,同时第三周期RSI小于60,且当前收盘价在200日SMA之上时,才会做多。平仓条件为RSI上穿50。
策略原理
- 计算指定周期的RSI指标
- 判断是否满足以下开仓条件:
- 当前RSI小于35
- 当前RSI小于前一周期RSI,前一周期RSI小于前二周期RSI,前二周期RSI小于前三周期RSI
- 前三周期RSI小于60
- 当前收盘价大于200日SMA
- 若同时满足上述四个条件,则开仓做多
- 持仓过程中,若RSI上穿50,则平仓
- 重复步骤2-4,进行下一次交易
策略优势
- 通过RSI判断超买超卖,在超卖区域开仓,能够捕捉到市场反转机会
- 通过三重RSI共同构建开仓信号,降低了假信号概率,提高了信号可靠性
- 加入价格在200日均线之上作为趋势条件,避免在下跌趋势中交易
- 平仓条件简单明了,能够及时兑现利润
- 策略逻辑清晰,易于理解和实现
策略风险
- RSI指标存在信号滞后性,可能错过最佳开仓时机
- 开仓条件相对严格,交易频率较低,可能错失部分行情
- 对于震荡市可能表现不佳,陷入频繁开平仓
- 策略只能捕捉到单边上涨行情,对于趋势反转后的下跌行情无法把握
策略优化方向
- 可以考虑加入移动止损或固定止损,控制单笔交易风险
- 研究RSI与其他辅助指标的结合,提高开平仓信号的可靠性和及时性
- 对开仓条件进行优化,在保证信号可靠性的同时提高交易频率
- 引入仓位管理,根据市场趋势强度和波动率动态调整仓位
- 考虑短线和中线结合,开发出适应不同市场状态的策略版本
总结
该策略通过三重RSI构建开仓条件,结合价格在长期均线之上作为趋势过滤,以此捕捉超卖反转行情。策略逻辑简单明了,易于实现和优化。但是策略也存在信号滞后、交易频率低、只能捕捉单边行情等风险和不足,需要在实际应用中不断调试和改进。通过引入止损止盈、仓位管理、结合其他指标等方法,可以进一步提升策略的稳定性和收益性。
策略源码
/*backtest
start: 2023-05-15 00:00:00
end: 2024-05-14 00:00:00
period: 1d
basePeriod: 1h
exchanges: [{"eid":"Futures_Binance","currency":"BTC_USDT"}]
*/

//@version=5
//@author Honestcowboy
//
strategy("Triple RSI [Honestcowboy]" )


// $$$$$$$$$$$$$$$$$$$$$$$$$$$$$$$$$$$ >>
// ---------> User Inputs <----------- >>
// $$$$$$$$$$$$$$$$$$$$$$$$$$$$$$$$$$$ >>

rsiLengthInput = input.int(5, minval=1, title="RSI Length", group="RSI Settings")
rsiSourceInput = input.source(close, "Source", group="RSI Settings")

// $$$$$$$$$$$$$$$$$$$$$$$$$$$$$$$$$$$$$$$$$$$$$ >>
// ---------> VARIABLE CALCULATIONS <----------- >>
// $$$$$$$$$$$$$$$$$$$$$$$$$$$$$$$$$$$$$$$$$$$$$ >>

up = ta.rma(math.max(ta.change(rsiSourceInput), 0), rsiLengthInput)
down = ta.rma(-math.min(ta.change(rsiSourceInput), 0), rsiLengthInput)
rsi = down == 0 ? 100 : up == 0 ? 0 : 100 - (100 / (1 + up / down))

// $$$$$$$$$$$$$$$$$$$$$$$$$$$$$$$$$$$$ >>
// ---------> CONDITIONALS <----------- >>
// $$$$$$$$$$$$$$$$$$$$$$$$$$$$$$$$$$$$ >>

rule1   = rsi<35
rule2   = rsi<rsi[1] and rsi[1]<rsi[2] and rsi[2]<rsi[3]
rule3   = rsi[3]<60
rule4   = close>ta.sma(close, 200)

longCondition = rule1 and rule2 and rule3 and rule4
closeCondition = rsi>50

// $$$$$$$$$$$$$$$$$$$$$$$$$$$$$$$$$$$$$$$$$ >>
// ---------> GRAPHICAL DISPLAY <----------- >>
// $$$$$$$$$$$$$$$$$$$$$$$$$$$$$$$$$$$$$$$$$ >>

hline(30, title="Long Condition Line")
hline(50, title="Exit Condition Line")
plot(rsi)
plotshape(longCondition ? rsi-3 : na, title="Long Condition", style=shape.triangleup, color=color.lime, location=location.absolute)
plotshape(closeCondition and rsi[1]<50? rsi+3 : na, title="Exit Condition", style=shape.triangledown, color=#e60000, location=location.absolute)

// $$$$$$$$$$$$$$$$$$$$$$$$$$$$$$$$$$$$$$$$$$$$$$$$$$ >>
// ---------> AUTOMATION AND BACKTESTING <----------- >>
// $$$$$$$$$$$$$$$$$$$$$$$$$$$$$$$$$$$$$$$$$$$$$$$$$$ >>

if longCondition and strategy.position_size==0
    strategy.entry("LONG", strategy.long)
if closeCondition
    strategy.close("LONG")
相关推荐