
Overview
The "Crypto Big Move Stochastic RSI Strategy" is a sophisticated trading algorithm designed for the TradingView platform, leveraging the power of Stochastic RSI combined with significant price movement detection to capitalize on market trends. The strategy is tailored for cryptocurrency markets and is optimized for a 15-minute trading timeframe.
The main idea behind the strategy is to use the Stochastic RSI indicator and significant price movement detection to generate trading signals when the market experiences substantial fluctuations and the Stochastic RSI reaches oversold or overbought levels. By combining these two conditions, the strategy can capture trading opportunities early in the trend while avoiding frequent trades in choppy markets.
Strategy Principles
-
Calculate the RSI and Stochastic RSI indicators. The RSI is used to measure overbought and oversold price conditions, while the Stochastic RSI further processes the RSI values to obtain smoother and more reliable overbought and oversold signals.
-
Detect significant price movements. The strategy compares the current closing price with the closing price from lookbackPeriod bars ago and calculates the percentage change. If the percentage change exceeds the bigMoveThreshold, a significant price movement is considered to have occurred.
-
Determine entry conditions based on Stochastic RSI levels and big price moves. When the Stochastic RSI %K line or %D line is below 3, and a significant upward move occurs, a long signal is generated. When the Stochastic RSI %K line or %D line is above 97, and a significant downward move occurs, a short signal is generated.
-
Execute trades. If a long signal is triggered, the strategy enters a long position. If a short signal is triggered, the strategy enters a short position.
-
Plot entry signals for visual confirmation. The strategy marks long and short signals on the chart for easy viewing and verification of trades.
Strategy Advantages
-
By combining Stochastic RSI and significant price movement conditions, the strategy can capture trading opportunities early in the trend while avoiding frequent trades in choppy markets, thus improving the strategy's profitability and stability.
-
The Stochastic RSI indicator smooths the RSI values, providing more reliable overbought and oversold signals, which helps improve the accuracy of the strategy.
-
Through parameter optimization, the strategy's performance can be flexibly adjusted to adapt to different market conditions, trading instruments, and timeframes.
-
The strategy logic is clear and easy to understand and implement, serving as a foundation for further development and optimization.
Strategy Risks
-
The strategy performs well in trending markets but may generate more false signals in choppy markets, leading to frequent trades and capital losses.
-
The Stochastic RSI indicator has some lag, which may cause the strategy to miss the best entry points when the market changes rapidly.
-
The strategy relies on backtesting and optimization of historical data, and real-time trading performance may differ from historical results.
-
The strategy lacks explicit stop-loss and take-profit mechanisms, which may expose it to significant risks during extreme market volatility or black swan events.
Strategy Optimization Directions
-
Introduce additional technical indicators, such as moving averages and Bollinger Bands, to improve the reliability and accuracy of trading signals.
-
Incorporate fundamental analysis, such as news events and economic data, to filter and confirm trading signals and reduce false signals.
-
Optimize parameter settings, such as adjusting the Stochastic RSI time periods, overbought/oversold thresholds, etc., to adapt to different market conditions and trading instruments.
-
Implement risk management mechanisms, such as setting reasonable stop-loss and take-profit levels and controlling the risk exposure of individual trades, to improve the strategy's robustness and long-term performance.
-
Combine multi-timeframe analysis, such as confirming trend direction on higher timeframes and seeking entry points on lower timeframes, to enhance trading accuracy and profit potential.
Summary
The "Crypto Big Move Stochastic RSI Strategy" is a quantitative trading strategy that utilizes the Stochastic RSI indicator and significant price movement detection to capture trading opportunities. The strategy can generate trading signals early in the trend while avoiding frequent trades in choppy markets, showing some profit potential and stability. However, the strategy also has limitations and risks, such as generating more false signals in choppy markets and lacking explicit risk management mechanisms. In the future, the strategy can be further optimized and improved by introducing more technical indicators, optimizing parameter settings, incorporating fundamental analysis and risk management, and enhancing its performance and robustness in live trading.
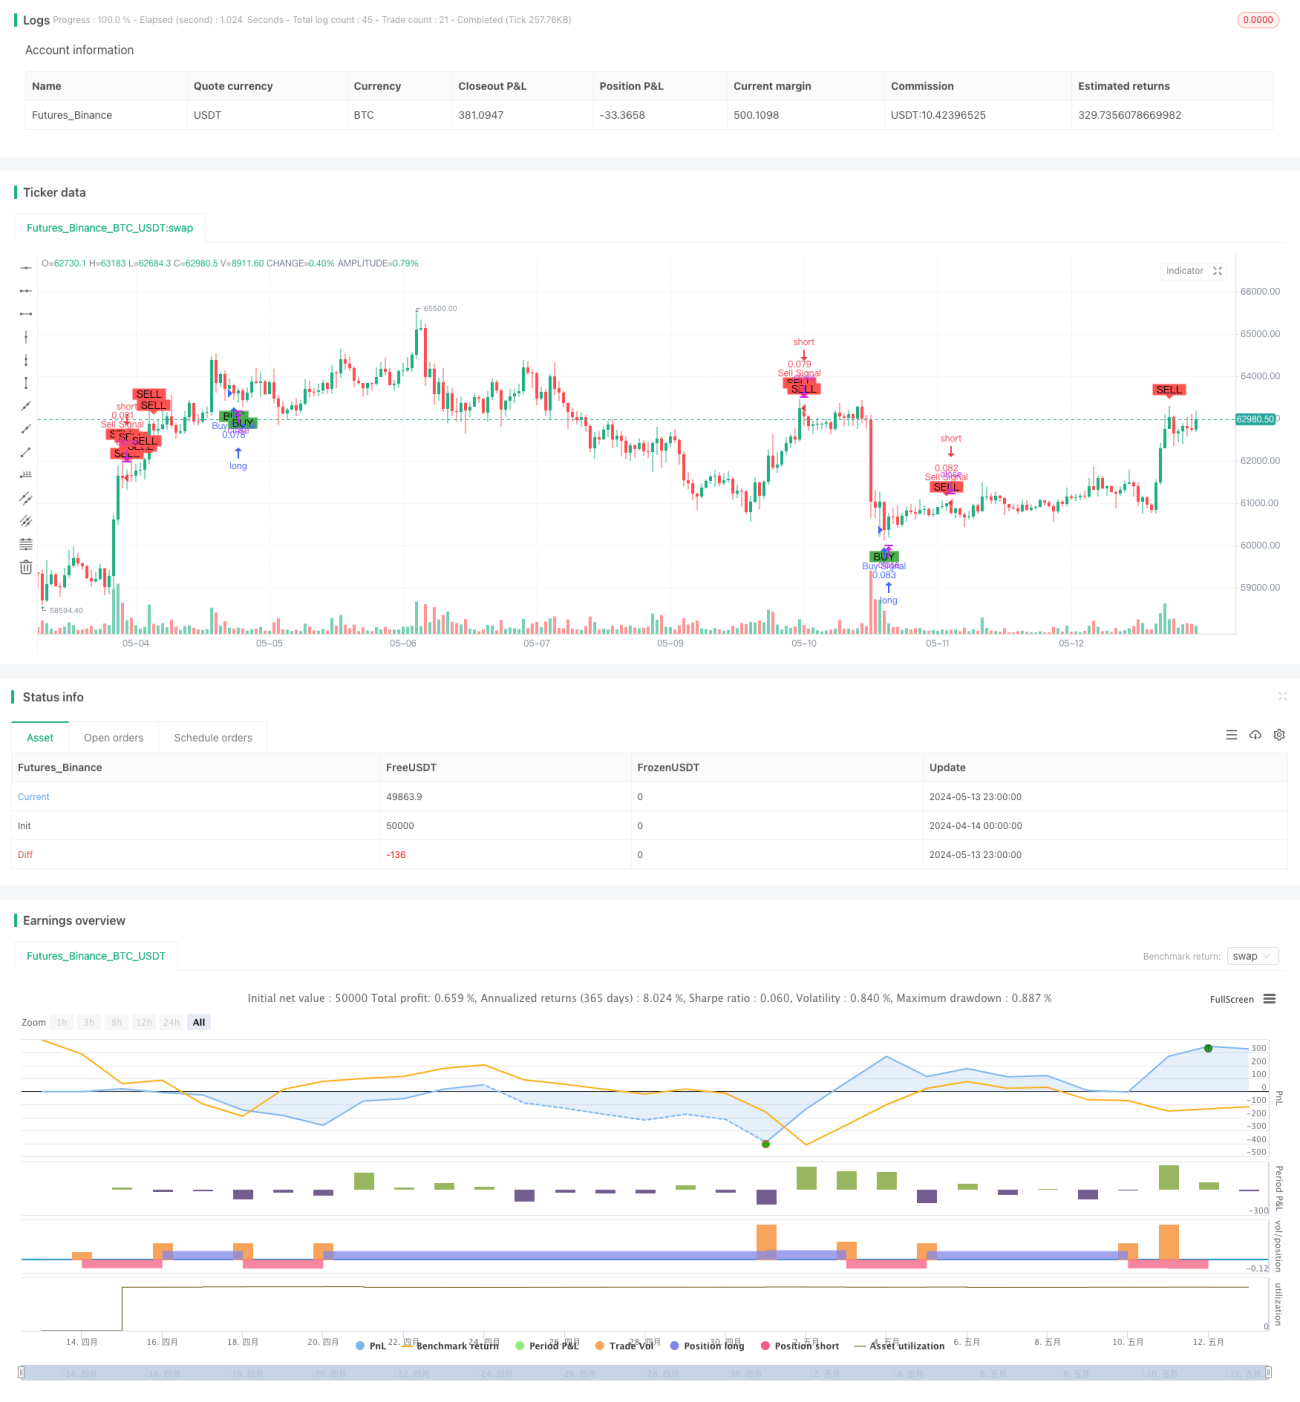
/*backtest
start: 2024-04-14 00:00:00
end: 2024-05-14 00:00:00
period: 1h
basePeriod: 15m
exchanges: [{"eid":"Futures_Binance","currency":"BTC_USDT"}]
*/

//@version=5
strategy("Crypto Big Move Stoch RSI Strategy", overlay=true, default_qty_type=strategy.percent_of_equity, default_qty_value=10)

// Define inputs- 1