Bollinger Bands Dynamic Breakout Strategy

Overview
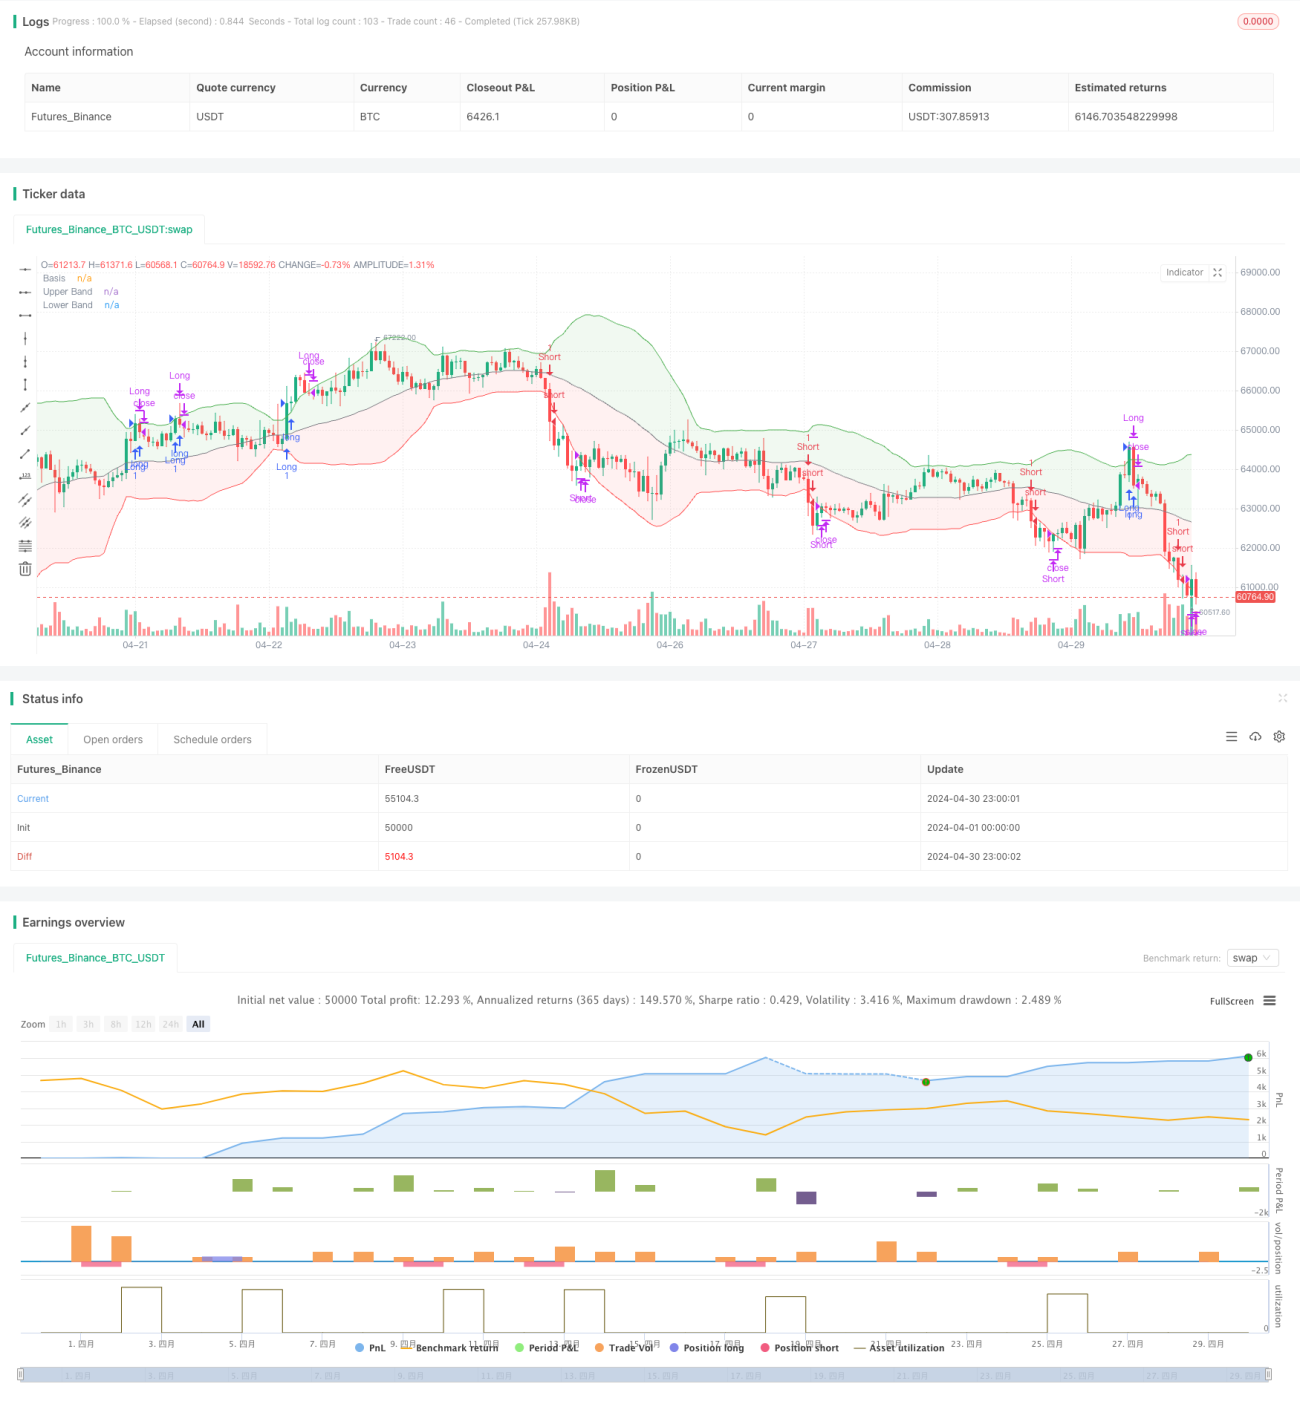
The Dynamic Bollinger Bands Breakout Strategy is a trading strategy based on the Bollinger Bands indicator. This strategy uses the upper and lower bands of the Bollinger Bands as dynamic support and resistance levels, buying when the price breaks above the upper band and selling when it breaks below the lower band. Bollinger Bands consist of a middle band (moving average), an upper band (middle band plus a multiple of standard deviation), and a lower band (middle band minus a multiple of standard deviation), which can be dynamically adjusted to adapt to market volatility.
Strategy Principle
- Calculate the middle, upper, and lower bands of the Bollinger Bands. The middle band is the simple moving average of the closing price, the upper band is the middle band plus a multiple of the standard deviation, and the lower band is the middle band minus a multiple of the standard deviation.
- When the price crosses above the upper band, open a long position; when the price crosses below the lower band, open a short position.
- When a long position exists, if the price crosses below the upper band, close the long position; when a short position exists, if the price crosses above the lower band, close the short position.
Strategy Advantages
- Bollinger Bands can dynamically adjust to adapt to different market volatility conditions, providing a certain degree of adaptability.
- The strategy logic is clear and easy to understand and implement.
- Bollinger Bands perform well when the market trend is strong and can effectively capture trends.
Strategy Risks
- In situations where market volatility is high and the trend is choppy, this strategy may frequently trade, leading to increased transaction costs.
- The selection of Bollinger Bands parameters (such as the moving average period and standard deviation multiple) will affect the strategy's performance, and different parameters may bring different results.
- This strategy does not consider other technical indicators or fundamental factors and relies solely on the relationship between price and Bollinger Bands for trading decisions, which may face risks brought by a single signal.
Strategy Optimization Directions
- Introduce other technical indicators (such as RSI, MACD, etc.) as filtering conditions to confirm the validity of Bollinger Band breakouts and improve signal quality.
- Optimize Bollinger Bands parameters by backtesting and parameter scanning to find the best combination of moving average period and standard deviation multiple.
- Set appropriate stop-loss and take-profit levels to control single transaction risk and profit targets.
- Consider market conditions and volatility, dynamically adjusting strategy parameters or position sizes under different market conditions.
Summary
The Dynamic Bollinger Bands Breakout Strategy is a simple and easy-to-use trading strategy that generates trading signals through breakouts of the upper and lower bands of the Bollinger Bands. This strategy performs well in trending markets but may face frequent trading issues in choppy markets. Optimization directions include combining other technical indicators, optimizing parameters, setting appropriate stop-losses and take-profits, and adjusting strategies according to market conditions. In practical applications, it is necessary to make appropriate adjustments and optimizations based on specific market characteristics and personal risk preferences.
- 1