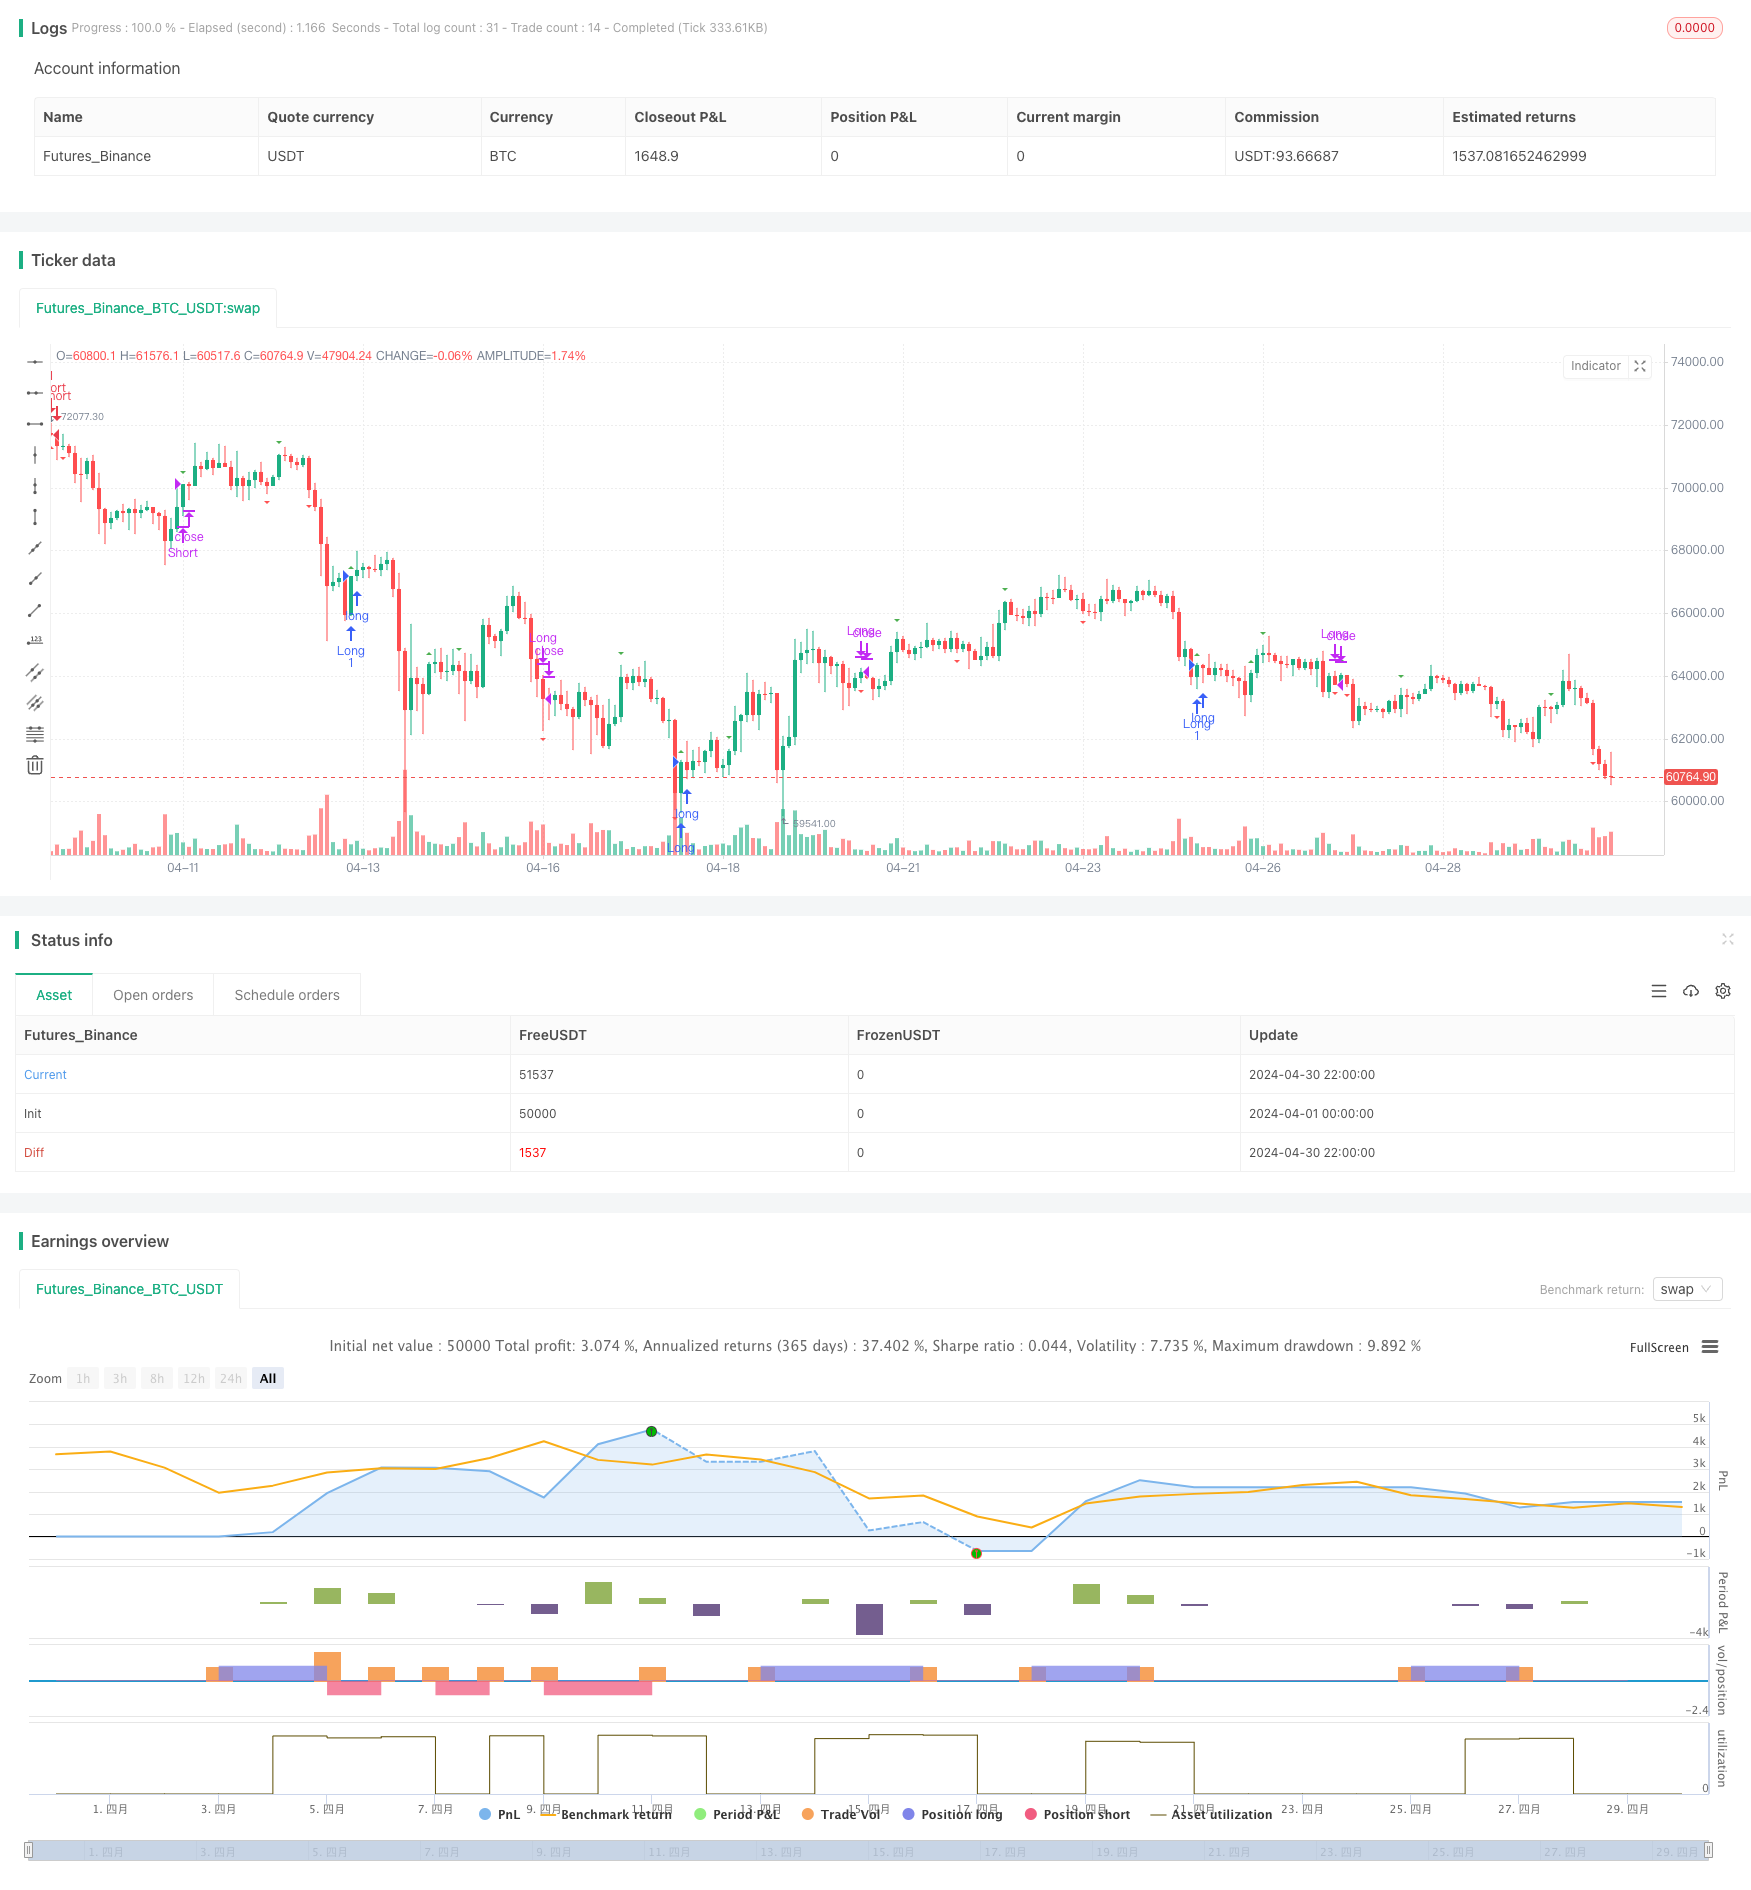
概述
该策略结合了相对强弱指数(RSI)和移动平均线聚散指标(MACD)两个技术指标,利用RSI判断超买超卖情况,MACD判断趋势方向,形成一套完整的多空策略。当RSI超买时发出卖出信号,MACD快慢线交叉向上时平仓;当RSI超卖时发出买入信号,MACD快慢线交叉向下时平仓。止损点的设置通过计算该品种平均涨跌幅的一半来确定。
策略原理
- 计算RSI指标,判断超买超卖:
- 当RSI大于70,且由上向下穿越70线时,发出卖出信号
- 当RSI小于30,且由下向上穿越30线时,发出买入信号
- 计算MACD指标,判断趋势方向:
- 当MACD快线由下向上穿越慢线时,发出平仓卖出仓位的信号
- 当MACD快线由上向下穿越慢线时,发出平仓买入仓位的信号
- 止损点的设置:
- 计算该品种平均涨跌幅,取其一半作为止损点
通过RSI判断超买超卖情况,在行情反转初期介入;利用MACD判断趋势方向,在趋势初期平仓,能够较好地把握趋势。两个指标互为补充,形成完整的交易系统。
策略优势
- 结合了超买超卖和趋势跟踪两种策略,能够在行情反转初期介入,趋势形成后及时平仓,有效避免行情反复震荡导致的亏损。
- 止损点的设置基于品种的波动特性,能够控制回撤,提高资金利用效率。
- 代码逻辑清晰,使用了函数化编程方式,易于理解和优化。
策略风险
- RSI和MACD参数的选择对策略性能影响较大,不同品种和周期可能需要进行参数优化。
- 在市场发生极端行情时,如突发事件导致的快速变盘,该策略可能遭受较大回撤。
- 策略在震荡市中表现可能不佳,会出现频繁交易,导致较高的交易成本。
策略优化方向
- 对RSI和MACD的参数进行优化,找到最适合当前品种和周期的参数组合,提高策略的稳定性和盈利能力。
- 加入更多过滤条件,如交易量、波动率等指标,减少频繁交易,提高信号质量。
- 引入仓位管理模块,根据市场趋势和自身绩效动态调整仓位,控制回撤。
- 结合其他策略,如趋势跟踪、均值回复等,形成多策略组合,提高策略适应性。
总结
该策略通过RSI判断超买超卖情况,MACD判断趋势方向,形成了一套完整的多空交易系统。策略逻辑清晰,优势明显,同时也存在一定的风险。通过参数优化、加入过滤条件、仓位管理以及与其他策略结合等方式,可以进一步提高该策略的性能,使其成为一个稳健的交易策略。
策略源码
/*backtest
start: 2024-04-01 00:00:00
end: 2024-04-30 23:59:59
period: 2h
basePeriod: 15m
exchanges: [{"eid":"Futures_Binance","currency":"BTC_USDT"}]
*/

//@version=5
strategy(title="RSI & MACD Strategy", shorttitle="RSI & MACD", overlay=true)

// Définition des entrées
rsi_length = 14
rsi_overbought = 70
rsi_oversold = 30
macd_fast_length = 12
macd_slow_length = 26
macd_signal_length = 9

// Fonction pour calculer le RSI
calculate_rsi(source, length) =>
    price_change = ta.change(source)
    up = ta.rma(price_change > 0 ? price_change : 0, length)
    down = ta.rma(price_change < 0 ? -price_change : 0, length)
    rs = up / down
    rsi = 100 - (100 / (1 + rs))
    rsi

// Fonction pour calculer le MACD
calculate_macd(source, fast_length, slow_length, signal_length) =>
    fast_ma = ta.ema(source, fast_length)
    slow_ma = ta.ema(source, slow_length)
    macd = fast_ma - slow_ma
    signal = ta.ema(macd, signal_length)
    hist = macd - signal
    [macd, signal, hist]

// Calcul des indicateurs
rsi_value = calculate_rsi(close, rsi_length)
[macd_line, signal_line, _] = calculate_macd(close, macd_fast_length, macd_slow_length, macd_signal_length)

// Conditions d'entrée et de sortie
// Entrée en vente : RSI passe de >= 70 à < 70
sell_entry_condition = ta.crossunder(rsi_value, rsi_overbought)

// Sortie en vente : MACD fast MA croise au-dessus de slow MA
sell_exit_condition = ta.crossover(macd_line, signal_line)

// Entrée en achat : RSI passe de <= 30 à > 30
buy_entry_condition = ta.crossover(rsi_value, rsi_oversold)

// Sortie en achat : MACD fast MA croise en-dessous de slow MA
buy_exit_condition = ta.crossunder(macd_line, signal_line)

// Affichage des signaux sur le graphique
plotshape(series=sell_entry_condition, title="Sell Entry", location=location.belowbar, color=color.red, style=shape.triangleup, size=size.small)
plotshape(series=sell_exit_condition, title="Sell Exit", location=location.abovebar, color=color.green, style=shape.triangledown, size=size.small)
plotshape(series=buy_entry_condition, title="Buy Entry", location=location.abovebar, color=color.green, style=shape.triangleup, size=size.small)
plotshape(series=buy_exit_condition, title="Buy Exit", location=location.belowbar, color=color.red, style=shape.triangledown, size=size.small)

// Entrées et sorties de la stratégie
if (sell_entry_condition)
    strategy.entry("Short", strategy.short)

if (sell_exit_condition)
    strategy.close("Short")

if (buy_entry_condition)
    strategy.entry("Long", strategy.long)

if (buy_exit_condition)
    strategy.close("Long")
相关推荐