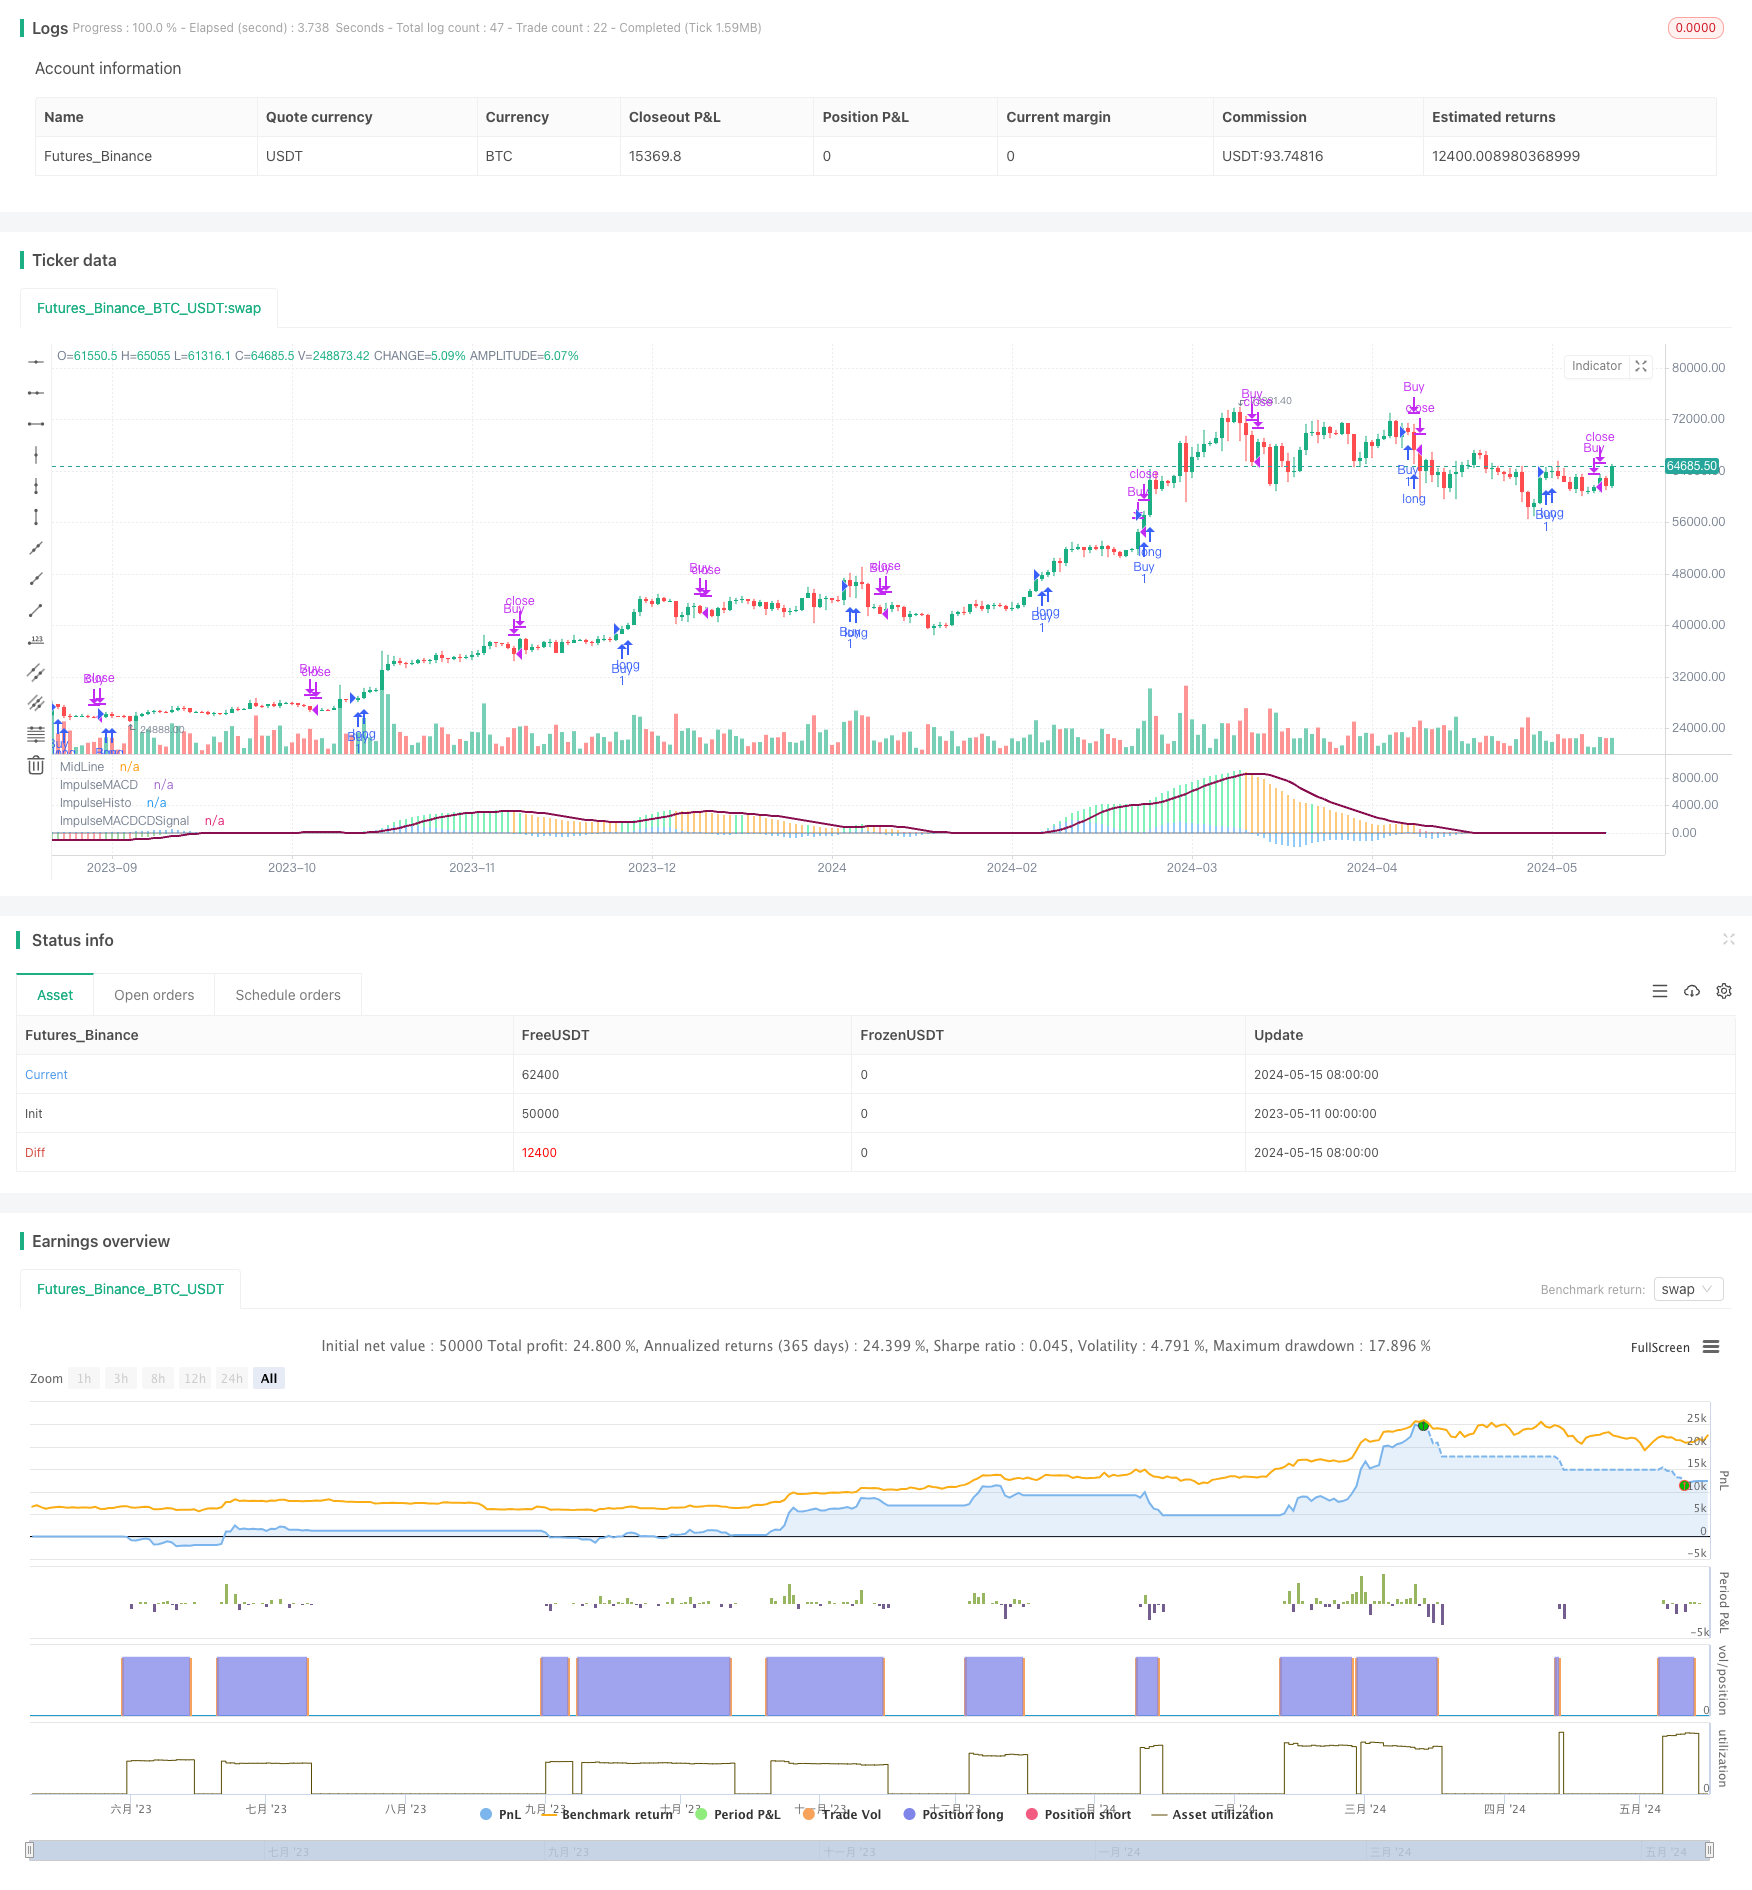
概述
该策略使用了多种移动平均线指标,包括SMMA、SMA、ZLEMA和EMA,并基于它们构建了一个改进的MACD指标(Impulse MACD),通过Impulse MACD与其信号线的交叉来产生交易信号。策略的主要思路是利用不同时间尺度的移动平均线来捕捉市场趋势,同时使用Impulse MACD来确认趋势的强度和方向。
策略原理
- 计算长度为34的高价、低价、收盘价的SMMA,ZLEMA,得到Impulse MACD(MD)。
- 计算Impulse MACD的9周期SMA作为信号线(SB)。
- 计算Impulse MACD与信号线的差值(SH),反映趋势强度。
- 当Impulse MACD上穿信号线时产生买入信号,下穿时平仓。
- 根据价格与Impulse MACD、高低价SMMA的关系,用不同颜色绘制Impulse MACD柱状图,直观反映趋势强弱。
策略优势
- 使用了多种类型的移动平均线,能够更全面地反映市场趋势。
- 改进的MACD指标(Impulse MACD)考虑了价格与移动平均线的相对位置,能够更好地反映趋势强度。
- 信号线的引入有助于过滤掉一些假信号,提高信号质量。
- 根据趋势强度用不同颜色绘制Impulse MACD,便于直观判断行情走势。
策略风险
- 参数选择不当可能导致信号频繁或滞后,需要根据不同市场和周期进行优化。
- 对于震荡行情,该策略可能产生较多虚假信号而导致亏损。
- 策略缺乏止损机制,遇到剧烈行情可能面临较大回撤。
策略优化方向
- 引入趋势判断指标,如ADX等,在趋势明确时才进行交易,减少震荡行情中的亏损。
- 对于产生的交易信号,可以结合其他指标如RSI、ATR等进行二次确认,提高信号质量。
- 设置合理的止损和止盈位,控制单次交易风险。
- 对参数进行优化,如使用遗传算法等方法寻找最优参数组合。
总结
该策略基于多种类型移动平均线构建了改进的MACD指标,并用其与信号线的交叉产生交易信号,同时直观地展示趋势强度,整体思路清晰,优势明显。但是该策略也存在一定局限性,如对震荡行情适应性不足,缺乏风控措施等。可以考虑从趋势判断、信号确认、风险控制、参数优化等方面对策略进行进一步改进,以提升策略的稳健性和盈利能力。
策略源码
/*backtest
start: 2023-05-11 00:00:00
end: 2024-05-16 00:00:00
period: 1d
basePeriod: 1h
exchanges: [{"eid":"Futures_Binance","currency":"BTC_USDT"}]
*/

//@version=5
strategy("Impulse MACD Strategy [LazyBear]", shorttitle="IMACD_Strategy", overlay=false)

// Function to calculate SMMA
calc_smma(src, len) =>
    var float smma = na
    smma := na(smma[1]) ? ta.sma(src, len) : (smma[1] * (len - 1) + src) / len
    smma

// Function to calculate SMA
	ta.sma(src, len)
    sum = 0.0
    for i = 0 to len - 1
        sum := sum + src[i]
    sum / len

// Function to calculate ZLEMA
calc_zlema(src, length) =>
    var float ema1 = na
    var float ema2 = na
    var float d = na
    ema1 := ta.ema(src, length)
    ema2 := ta.ema(ema1, length)
    d := ema1 - ema2
    ema1 + d

// Function to calculate EMA
calc_ema(src, len) =>
    ema = 0.0
    ema := ta.ema(src, len)
    ema

// Inputs
lengthMA = input(34, title="Length of Moving Average")
lengthSignal = input(9, title="Length of Signal Line")

// Calculations
src = hlc3
hi = calc_smma(high, lengthMA)
lo = calc_smma(low, lengthMA)
mi = calc_zlema(src, lengthMA)

md = mi > hi ? (mi - hi) : mi < lo ? (mi - lo) : 0
sb = ta.sma(md, lengthSignal)
sh = md - sb
mdc = src > mi ? src > hi ? color.lime : color.green : src < lo ? color.red : color.orange

// Plotting
plot(0, color=color.gray, linewidth=1, title="MidLine")
plot(md, color=mdc, linewidth=2, title="ImpulseMACD", style=plot.style_histogram)
plot(sh, color=color.blue, linewidth=2, title="ImpulseHisto", style=plot.style_histogram)
plot(sb, color=color.maroon, linewidth=2, title="ImpulseMACDCDSignal")

// Execute trades based on signals
if (ta.crossover(md, sb))
    strategy.entry("Buy", strategy.long)
if (ta.crossunder(md, sb))
    strategy.close("Buy")
相关推荐