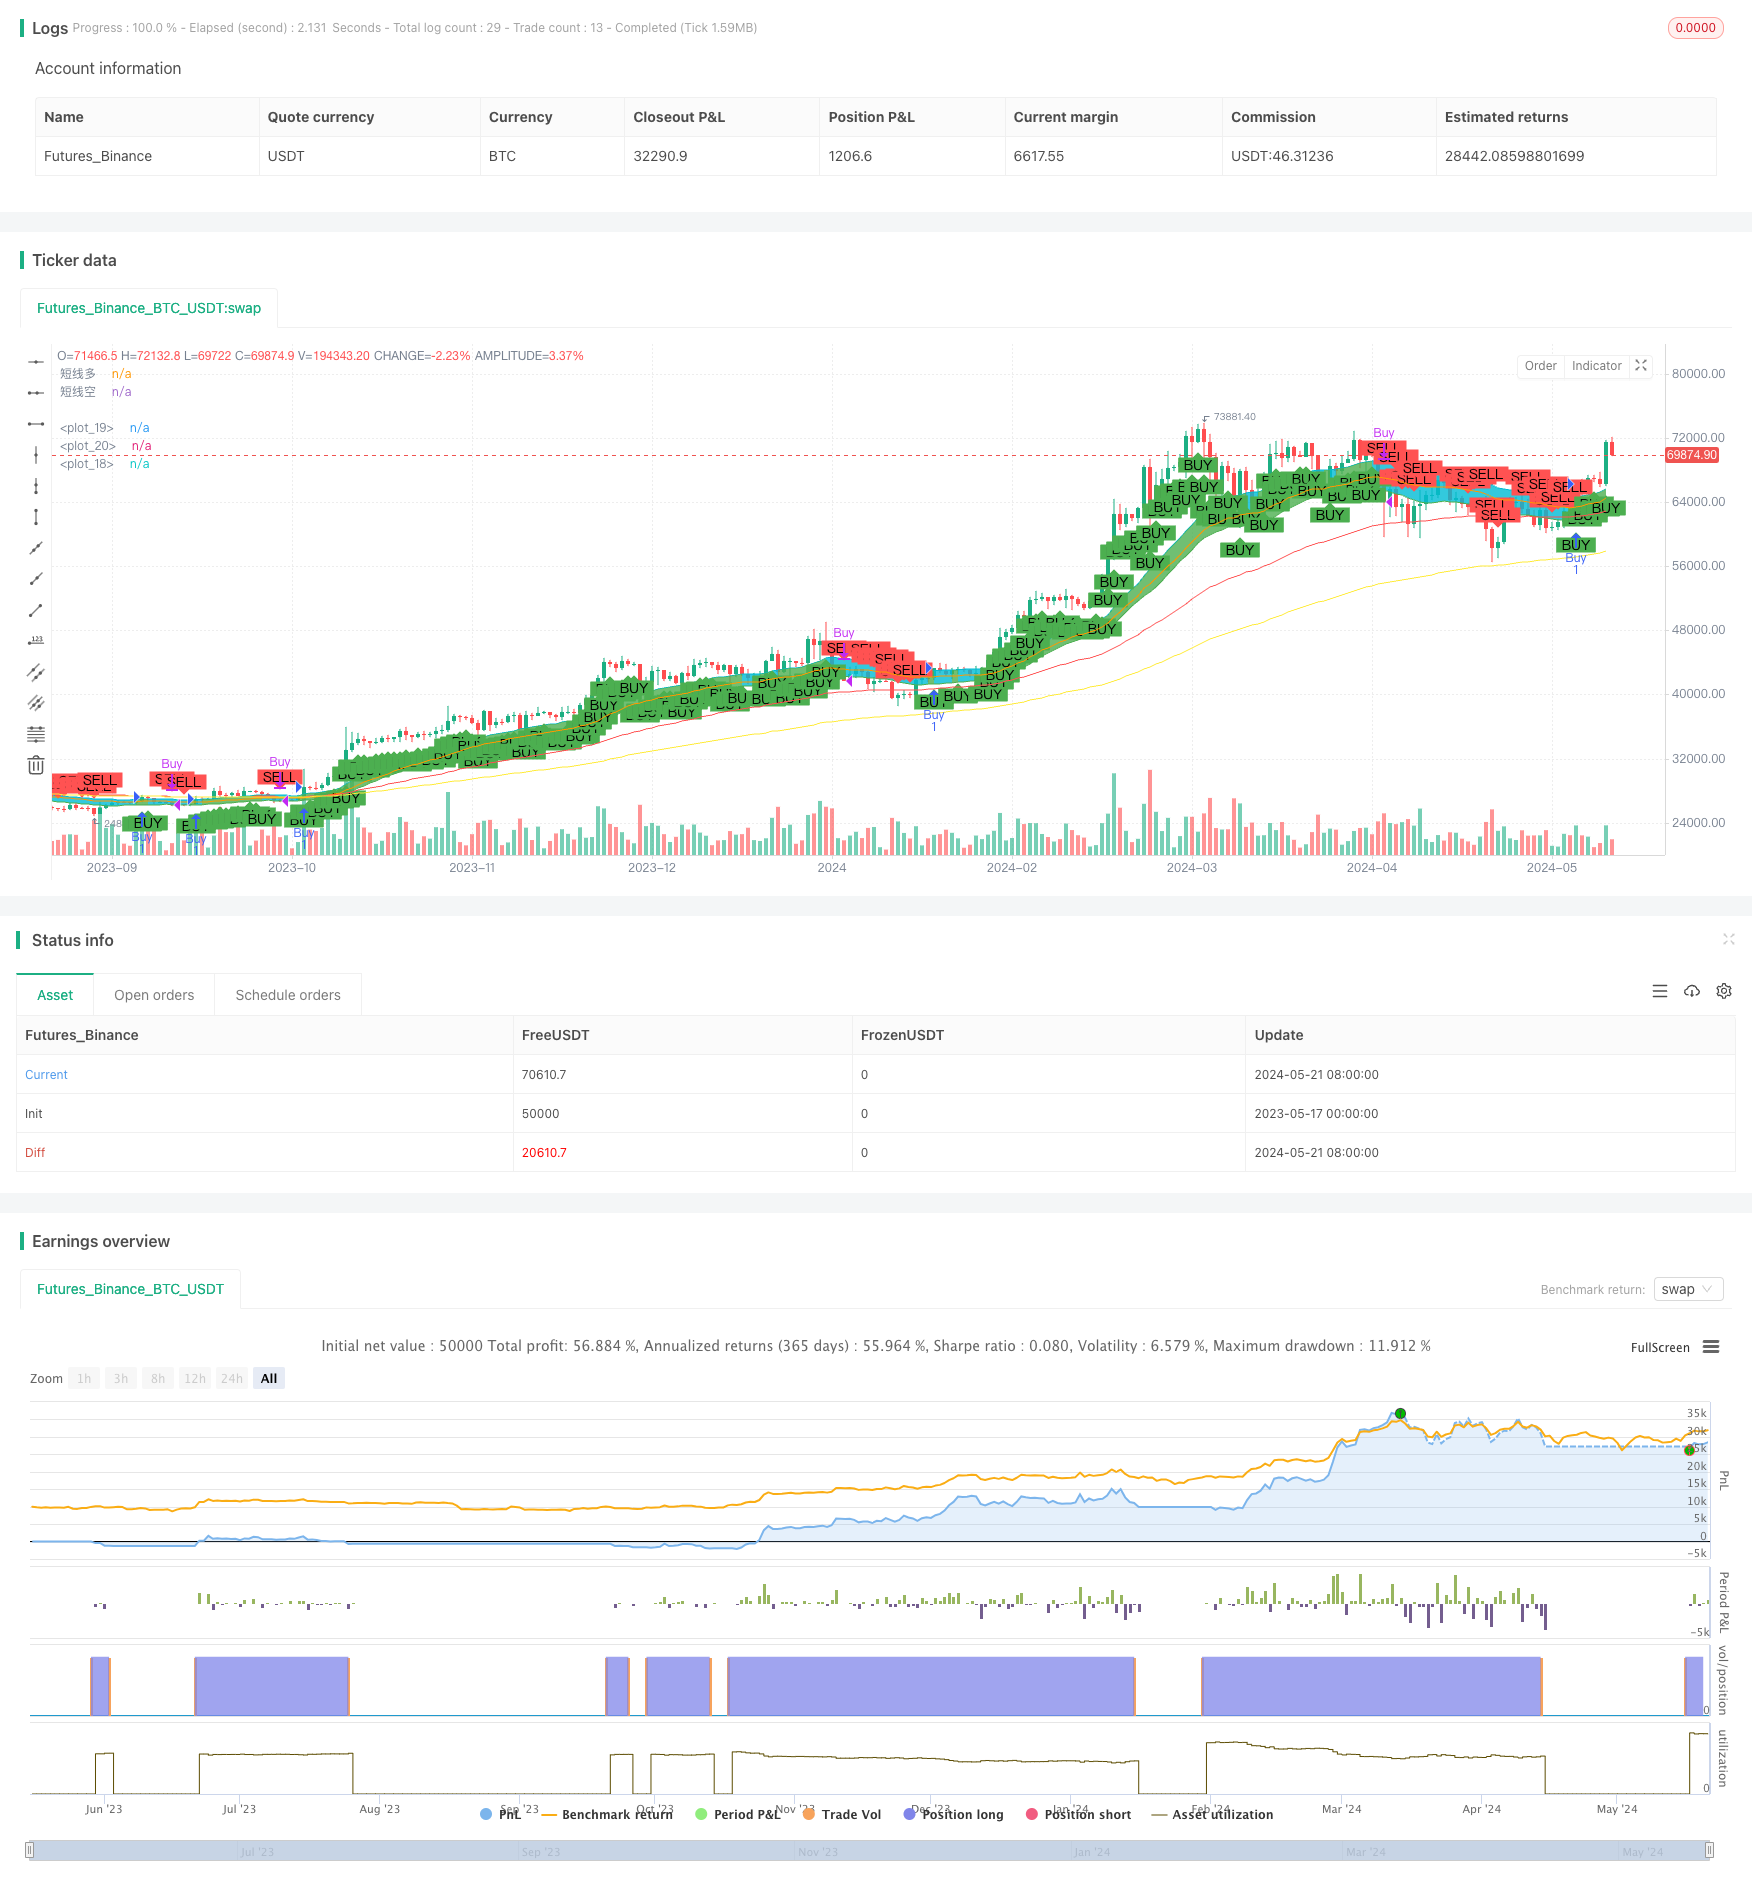
资源加载中... loading...

EMA Crossover with Short-term Signals Strategy

Author: ChaoZhang, Date: 2024-05-23 17:52:18
Tags: EMA

img

Overview

This strategy uses three EMA lines with different periods (144-day, 34-day, and 76-day) to capture the medium to long-term market trends. It also incorporates 30-day highest price and lowest price EMA lines as short-term long and short signals. When the closing price breaks above the short-term long signal, it opens a long position; when the closing price breaks below the short-term short signal, it closes the position. This approach allows for flexible position management while grasping the main market trend.

Strategy Principle

  1. Calculate the 144-day, 34-day, and 76-day EMA lines, representing the ultra-long-term, medium-term, and long-term trends, respectively.
  2. Calculate the 30-day highest price and lowest price EMA lines as short-term long and short signals.
  3. Open a long position when the closing price breaks above the 30-day highest price EMA line; close the position when the closing price breaks below the 30-day lowest price EMA line.
  4. Plot the EMA lines and short-term long/short signal range on the chart for a visual representation of market trends and signals.

Strategy Advantages

  1. By combining EMA lines of different periods, it comprehensively captures the ultra-long-term, long-term, and medium-term market trends.
  2. Utilizing the 30-day highest and lowest price EMA lines as short-term signals enables flexible position management within the trend, improving capital utilization efficiency.
  3. Clear plotting of various signals and trends on the chart facilitates traders’ intuitive judgment of market conditions.

Strategy Risks

  1. EMA lines have a certain degree of lag and may react slowly at market turning points.
  2. Short-term signals are greatly affected by market fluctuations, which may lead to frequent opening and closing of positions, increasing transaction costs.
  3. The strategy lacks stop-loss measures and may assume significant risks when the market experiences severe fluctuations.

Strategy Optimization Directions

  1. Introduce more EMA lines with different periods, such as 200-day and 50-day, to enrich the dimensions of trend judgment.
  2. Optimize the parameters of short-term signals, such as adjusting the period of the highest and lowest price EMA lines, to better adapt to different market conditions.
  3. Incorporate a stop-loss mechanism, such as setting a dynamic stop-loss level based on ATR, to control the maximum risk of a single trade.
  4. Consider adding trailing stop or trailing stop methods to better protect existing profits.

Summary

The EMA Crossover with Short-term Signals strategy captures market trends through multi-period EMA lines and achieves flexible position management using short-term price signals. It is a method that combines trend tracking with swing trading. However, this strategy also has issues such as lag, frequent trading, and lack of risk control, requiring further optimization to improve its robustness and profitability. By introducing more dimensions of trend judgment, dynamically adjusting signal parameters, incorporating reasonable stop-loss and take-profit mechanisms, and other methods, this strategy can be made more complete and reliable.


/*backtest
start: 2023-05-17 00:00:00
end: 2024-05-22 00:00:00
period: 1d
basePeriod: 1h
exchanges: [{"eid":"Futures_Binance","currency":"BTC_USDT"}]
*/

//@version=5
strategy("EMA Crossover with Short-term Signals", overlay=true)

// 定义EMA
shortest = ta.ema(close, 144)
short = ta.ema(close, 34)
longer = ta.ema(close, 76)

// 绘制EMA
plot(shortest, color=color.new(color.yellow, 0))
plot(short, color=color.new(color.orange, 0))
plot(longer, color=color.new(color.red, 0))

// 定义短线多空信号的EMA
stLong = ta.ema(high, 30)
stShort = ta.ema(low, 30)
stLongPlot = plot(stLong, '短线多', color.new(color.aqua, 0))
stShortPlot = plot(stShort, '短线空', color.new(color.green, 0))

// 绘制短线多空信号
clr = close > stLong ? color.green : color.aqua
fill(stLongPlot, stShortPlot, color=clr, transp=90)

// 交易信号
if (close > stLong)
    strategy.entry("Buy", strategy.long)
if (close < stShort)
    strategy.close("Buy")

// 显示买卖信号
plotshape(series=close > stLong, title="Buy Signal", location=location.belowbar, color=color.green, style=shape.labelup, text="BUY")
plotshape(series=close < stShort, title="Sell Signal", location=location.abovebar, color=color.red, style=shape.labeldown, text="SELL")


template: strategy.tpl:40:21: executing "strategy.tpl" at <.api.GetStrategyListByName>: wrong number of args for GetStrategyListByName: want 7 got 6