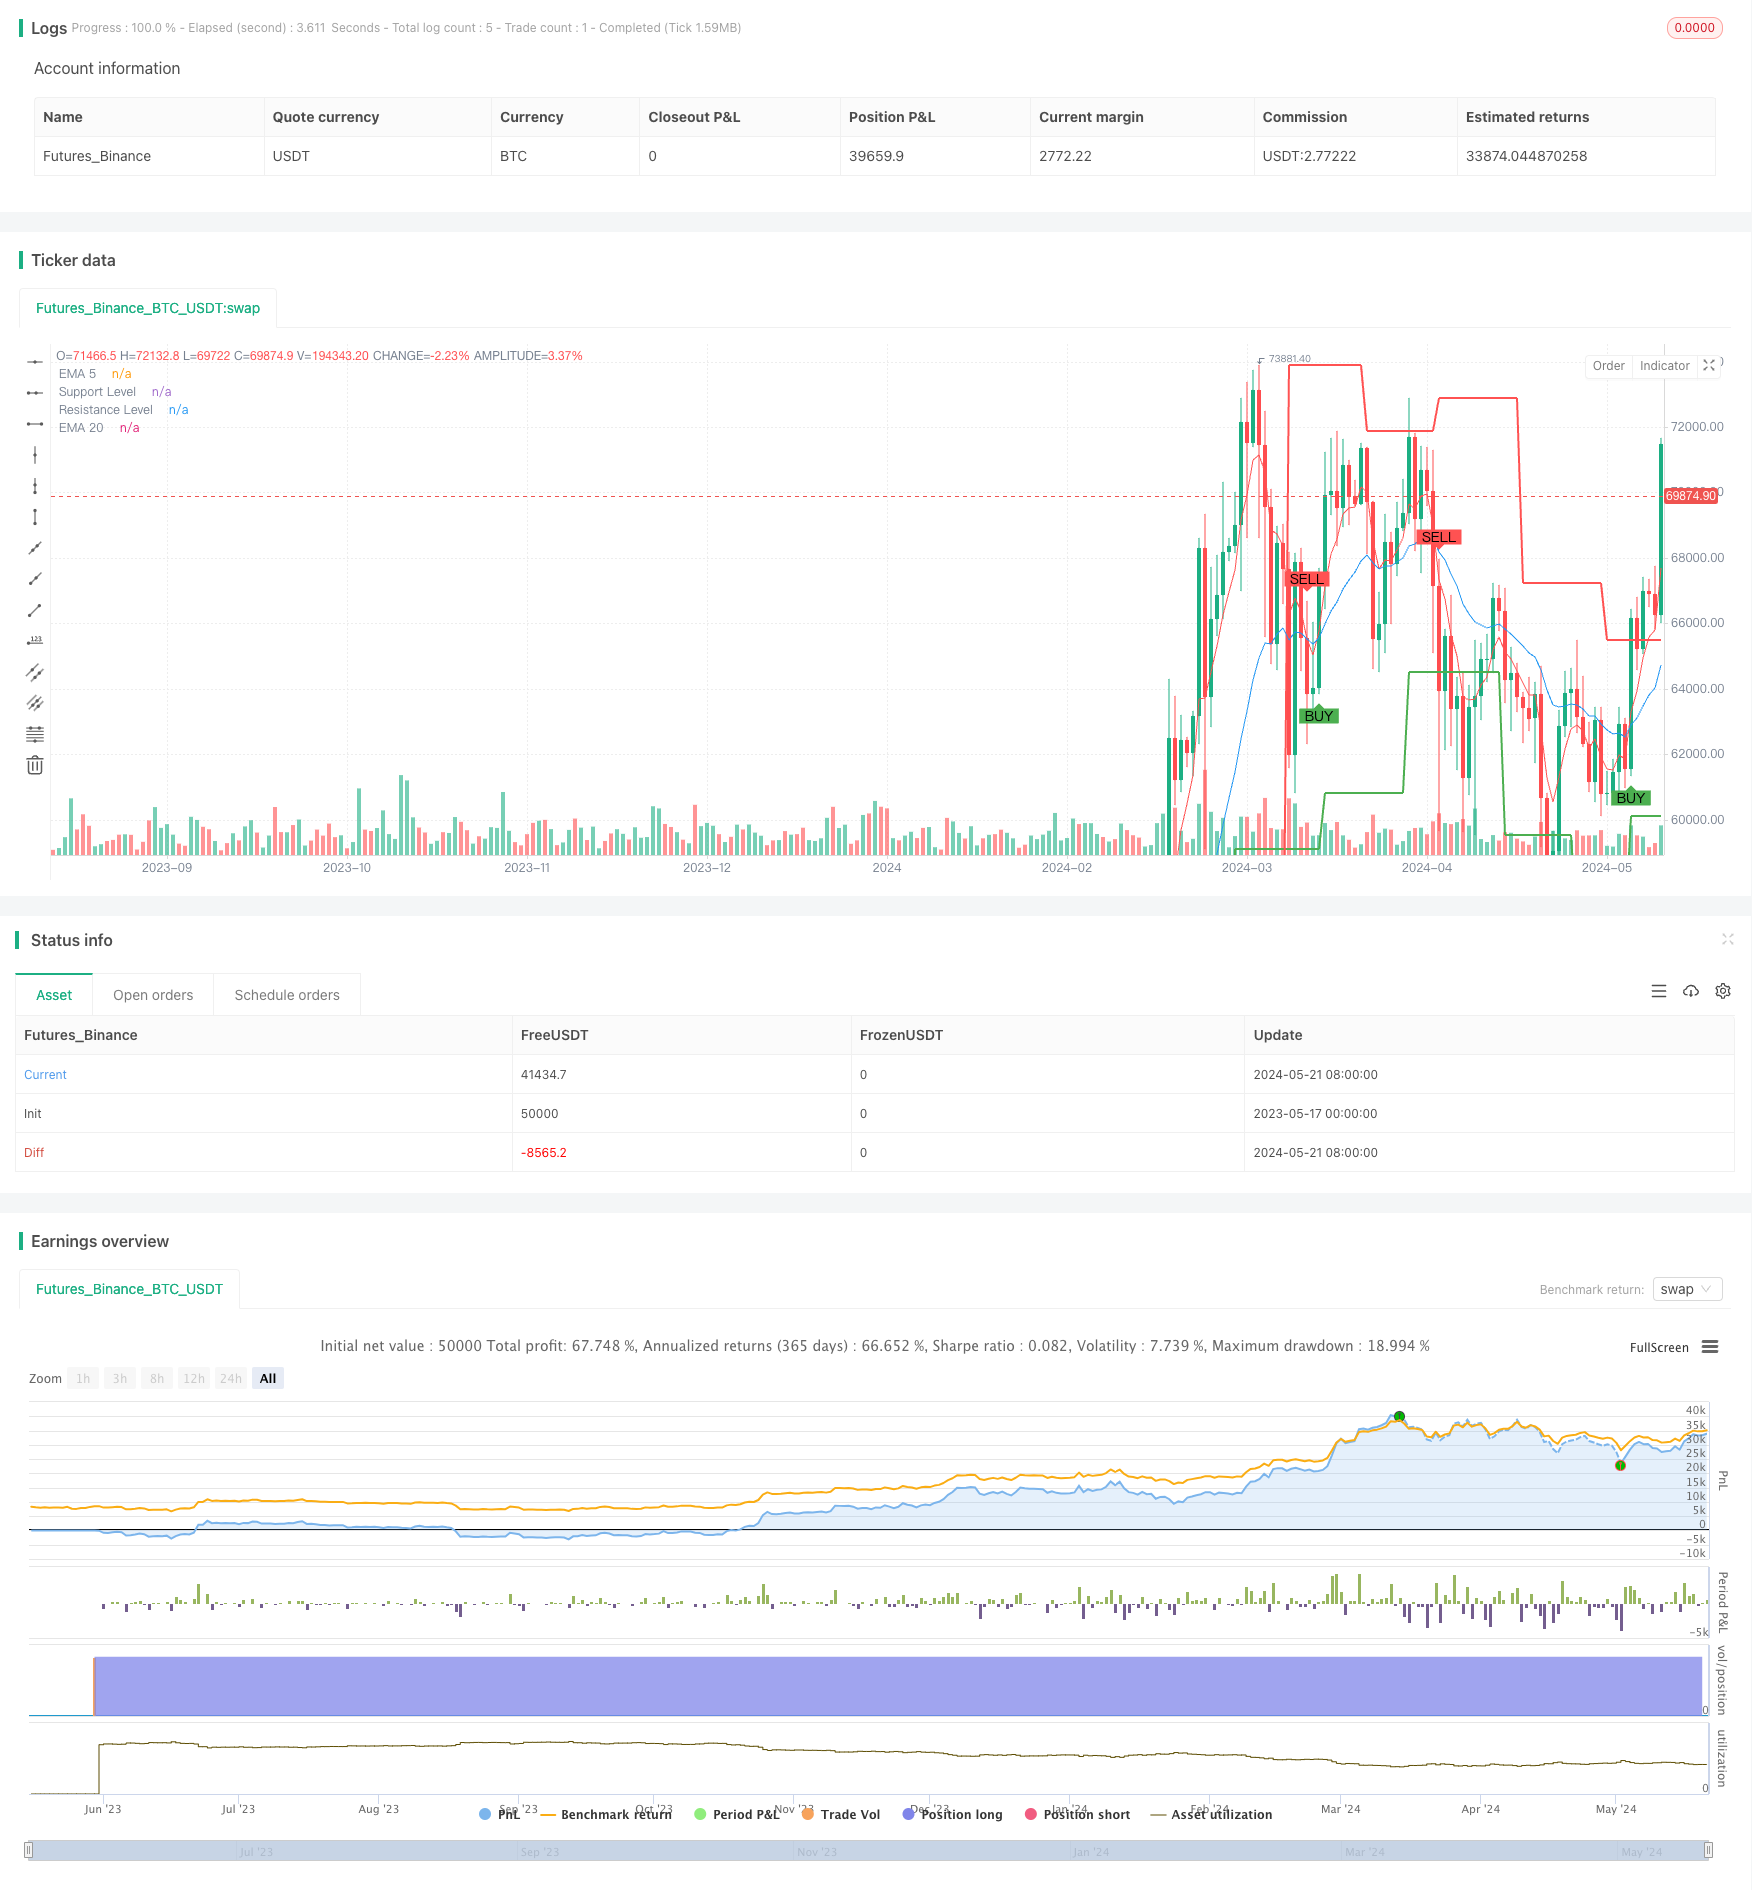
资源加载中... loading...

SMK ULTRA TREND Dual Moving Average Crossover Strategy

Author: ChaoZhang, Date: 2024-05-23 18:17:07
Tags: EMASMARSIMACDSMK

img

Overview

The SMK ULTRA TREND Dual Moving Average Crossover Strategy is a quantitative trading strategy that generates trading signals based on the crossover of the 5-day Exponential Moving Average (EMA5) and the 20-day Exponential Moving Average (EMA20). The core idea of this strategy is to capture changes in market trends by utilizing the crossover of short-term and medium-term moving averages. When the EMA5 crosses above the EMA20, it generates a buy signal, and when the EMA5 crosses below the EMA20, it generates a sell signal. Additionally, this strategy incorporates the concept of support and resistance levels by plotting support and resistance lines on the chart to assist in determining the direction and strength of the trend.

Strategy Principle

The principle of the SMK ULTRA TREND Dual Moving Average Crossover Strategy can be summarized in the following steps:

  1. Calculate the 5-day EMA and 20-day EMA. EMAs react faster to price changes compared to Simple Moving Averages (SMAs), making them more suitable for capturing short-term trends.
  2. Determine the crossover of EMA5 and EMA20. When the EMA5 crosses above the EMA20, it generates a buy signal; when the EMA5 crosses below the EMA20, it generates a sell signal.
  3. Calculate support and resistance levels. Identify the lowest low and highest high of the past 5 trading days to determine the support and resistance levels.
  4. Plot EMA5, EMA20, support line, and resistance line on the chart to visually display the strategy signals and key price levels.
  5. Execute trades based on the crossover signals. Open a long position when a buy signal appears and close the position when a sell signal appears.

Strategy Advantages

  1. Simplicity and ease of use: The strategy logic is clear, the indicators used are simple, and the calculation methods are easy to understand and implement, making it suitable for beginners in quantitative trading.
  2. Adaptability: The dual moving average crossover strategy can be applied to multiple trading instruments and time frames. By adjusting the moving average parameters, it can flexibly adapt to different market characteristics and trading styles.
  3. Trend following: The EMA indicators place more emphasis on recent price changes compared to SMAs, allowing for timely reflection of trend changes and aiding in trend following.
  4. Support and resistance level assistance: The introduction of support and resistance lines helps better grasp the strength of the trend and potential turning points, providing additional reference for trading decisions.

Strategy Risks

  1. Frequent trading: Since the strategy generates signals based on short-term moving average crossovers, it may result in frequent trading in range-bound markets, increasing trading costs and drawdown risks.
  2. Lag: As a trend-following strategy, the dual moving average crossover strategy inevitably has a certain degree of lag. It may miss the optimal entry points at the beginning of a trend or delay exits during trend reversals.
  3. False signals: In noisy market conditions, moving average crossovers may generate false signals, leading to suboptimal strategy performance.

Strategy Optimization Directions

  1. Signal filtering: In addition to moving average crossovers, introduce other technical indicators such as RSI and MACD to provide secondary confirmation of trading signals and improve signal reliability.
  2. Dynamic parameter optimization: Dynamically adjust the moving average parameters based on market conditions and instrument characteristics to better adapt to changes in market rhythm.
  3. Position sizing: Dynamically adjust position sizes based on trend strength, volatility, and other indicators. Increase position sizes during strong trends and decrease position sizes during uncertain trends or heightened risk.
  4. Stop-loss and take-profit: Set reasonable stop-loss levels and profit targets to control the risk exposure of individual trades and improve the strategy’s risk-reward ratio.

Summary

The SMK ULTRA TREND Dual Moving Average Crossover Strategy is a simple and practical quantitative trading strategy that captures market trends through the crossover signals of EMA5 and EMA20, while incorporating support and resistance lines as auxiliary tools to provide reference for trading decisions. The strategy’s advantages include clear logic, adaptability, ease of implementation, and optimization. However, it may experience frequent trading and false signals in range-bound markets. To improve the strategy’s performance, signal filtering, parameter optimization, position sizing, stop-loss, and take-profit techniques can be employed to enhance the strategy’s robustness and profitability.


/*backtest
start: 2023-05-17 00:00:00
end: 2024-05-22 00:00:00
period: 1d
basePeriod: 1h
exchanges: [{"eid":"Futures_Binance","currency":"BTC_USDT"}]
*/

//@version=5
strategy("SMK ULTRA TREND STRATEGY", overlay=true)

// Define the length for EMAs
ema5_length = 5
ema20_length = 20

// Calculate EMAs
ema5 = ta.ema(close, ema5_length)
ema20 = ta.ema(close, ema20_length)

// Plot EMAs
plot(ema5, title="EMA 5", color=color.red )
plot(ema20, title="EMA 20", color=color.blue)

// Generate buy and sell signals
buySignal = ta.crossover(ema5, ema20)
sellSignal = ta.crossunder(ema5, ema20)

// Plot buy and sell signals
plotshape(series=buySignal, location=location.belowbar, color=color.green, style=shape.labelup, text="BUY")
plotshape(series=sellSignal, location=location.abovebar, color=color.red, style=shape.labeldown, text="SELL")

// Execute buy and sell orders
if (buySignal)
    strategy.entry("Buy", strategy.long)
if (sellSignal)
    strategy.close("sell")

// Define support and resistance lengths
pivotLen = 5

// Calculate support and resistance levels
var float supportLevel = na
var float resistanceLevel = na

if (ta.pivotlow(low, pivotLen, pivotLen))
    supportLevel := low[pivotLen]

if (ta.pivothigh(high, pivotLen, pivotLen))
    resistanceLevel := high[pivotLen]

// Plot support and resistance levels
plot(supportLevel, title="Support Level", color=color.green, linewidth=2, style=plot.style_linebr)
plot(resistanceLevel, title="Resistance Level", color=color.red, linewidth=2, style=plot.style_linebr)

template: strategy.tpl:40:21: executing "strategy.tpl" at <.api.GetStrategyListByName>: wrong number of args for GetStrategyListByName: want 7 got 6