Multi-Indicator Quantitative Trading Strategy - Super Indicator 7-in-1 Strategy

Overview
The "Super Indicator 7-in-1 Strategy" is a quantitative trading strategy that integrates seven popular technical indicators, including the Relative Strength Index (RSI), Moving Average Convergence Divergence (MACD), Stochastic Oscillator, Bollinger Bands, Simple Moving Average (SMA), Exponential Moving Average (EMA), and Volume. By combining the signals from these indicators, the strategy aims to identify overbought and oversold market conditions and pinpoint optimal buying and selling opportunities. The strategy also incorporates take profit, stop loss, and time-based filters to optimize trade execution and risk management.
Strategy Principles
The core principle of this strategy is to leverage multiple technical indicators to obtain more comprehensive and reliable trading signals. Each indicator has its unique calculation method and perspective on interpreting market trends. For example, RSI measures the speed and strength of price movements; MACD determines trends based on moving average crossovers; the Stochastic Oscillator assesses overbought and oversold levels by comparing the closing price to the price range over a certain period; and Bollinger Bands set upper and lower bounds based on price volatility.
The strategy generates buy and sell signals by setting thresholds and evaluating the combined strength of multiple indicator signals. When indicators reach certain combinations of conditions, it triggers a trading signal. The strategy also considers other market information, such as volume, to confirm price movements. Additionally, the strategy incorporates risk management and optimization measures, including take profit, stop loss, and trading session filters, to seize opportunities while controlling risks.
Advantage Analysis
The main advantages of the "Super Indicator 7-in-1 Strategy" lie in its comprehensiveness and flexibility. By considering multiple indicators, the strategy can validate market signals from different angles, increasing the probability of generating reliable trading opportunities. Even if individual indicators produce misleading signals, as long as most indicators align, the strategy can still make correct judgments.
Moreover, the strategy offers a wide range of parameter options, allowing users to customize settings according to their preferences and trading styles. Different parameter combinations can generate signals with varying sensitivity and frequency, adapting to different market conditions. The strategy also includes built-in risk management tools, such as take profit, stop loss, and trading session filters, further enhancing its practicality and controllability.
Risk Analysis
Despite its numerous advantages, the strategy also has some potential risks. First, the strategy's performance heavily depends on the reasonableness of the selected parameters. Inappropriate parameter settings can lead to signal distortions and incorrect trading decisions. Second, the strategy primarily relies on historical data and statistical patterns, while market conditions are ever-changing, and past patterns may not apply to the future.
Furthermore, under extreme market conditions, multiple indicators may simultaneously fail, causing the strategy to make erroneous judgments. The strategy may also generate conflicting signals in choppy markets, resulting in overtrading and rapid capital depletion.
Optimization Directions
To further enhance the strategy's robustness and profit potential, consider the following optimization aspects:
- Conduct more systematic backtesting and optimization of indicator parameters to identify the optimal combination.
- Introduce additional non-price indicators, such as sentiment and fundamental indicators, to broaden the strategy's perspective.
- Refine the take profit and stop loss logic by setting dynamic percentages or employing trailing stops.
- Incorporate considerations for specific events (e.g., significant economic data releases) into the trading session filter.
- Perform secondary confirmation of the signals generated by the strategy, such as evaluating indicator performance across multiple timeframes.
Through these optimizations, the strategy can maintain its advantages while further enhancing its ability to navigate complex market environments, delivering more consistent returns for users.
Summary
In summary, the "Super Indicator 7-in-1 Strategy" is a powerful and well-designed quantitative trading strategy. It cleverly combines seven commonly used technical indicators to grasp market dynamics from multiple angles and provide traders with reliable buy and sell signals. The rich parameter options and built-in risk management tools make the strategy flexible, user-friendly, and adaptable.
However, the strategy's performance is still influenced by factors such as parameter selection and market conditions. Traders need to fine-tune the strategy based on their own experience and backtesting results. By introducing more indicator dimensions, optimizing take profit and stop loss logic, and refining trading session filters, the strategy can further enhance its risk resilience and profit potential, becoming a valuable tool for quantitative traders.
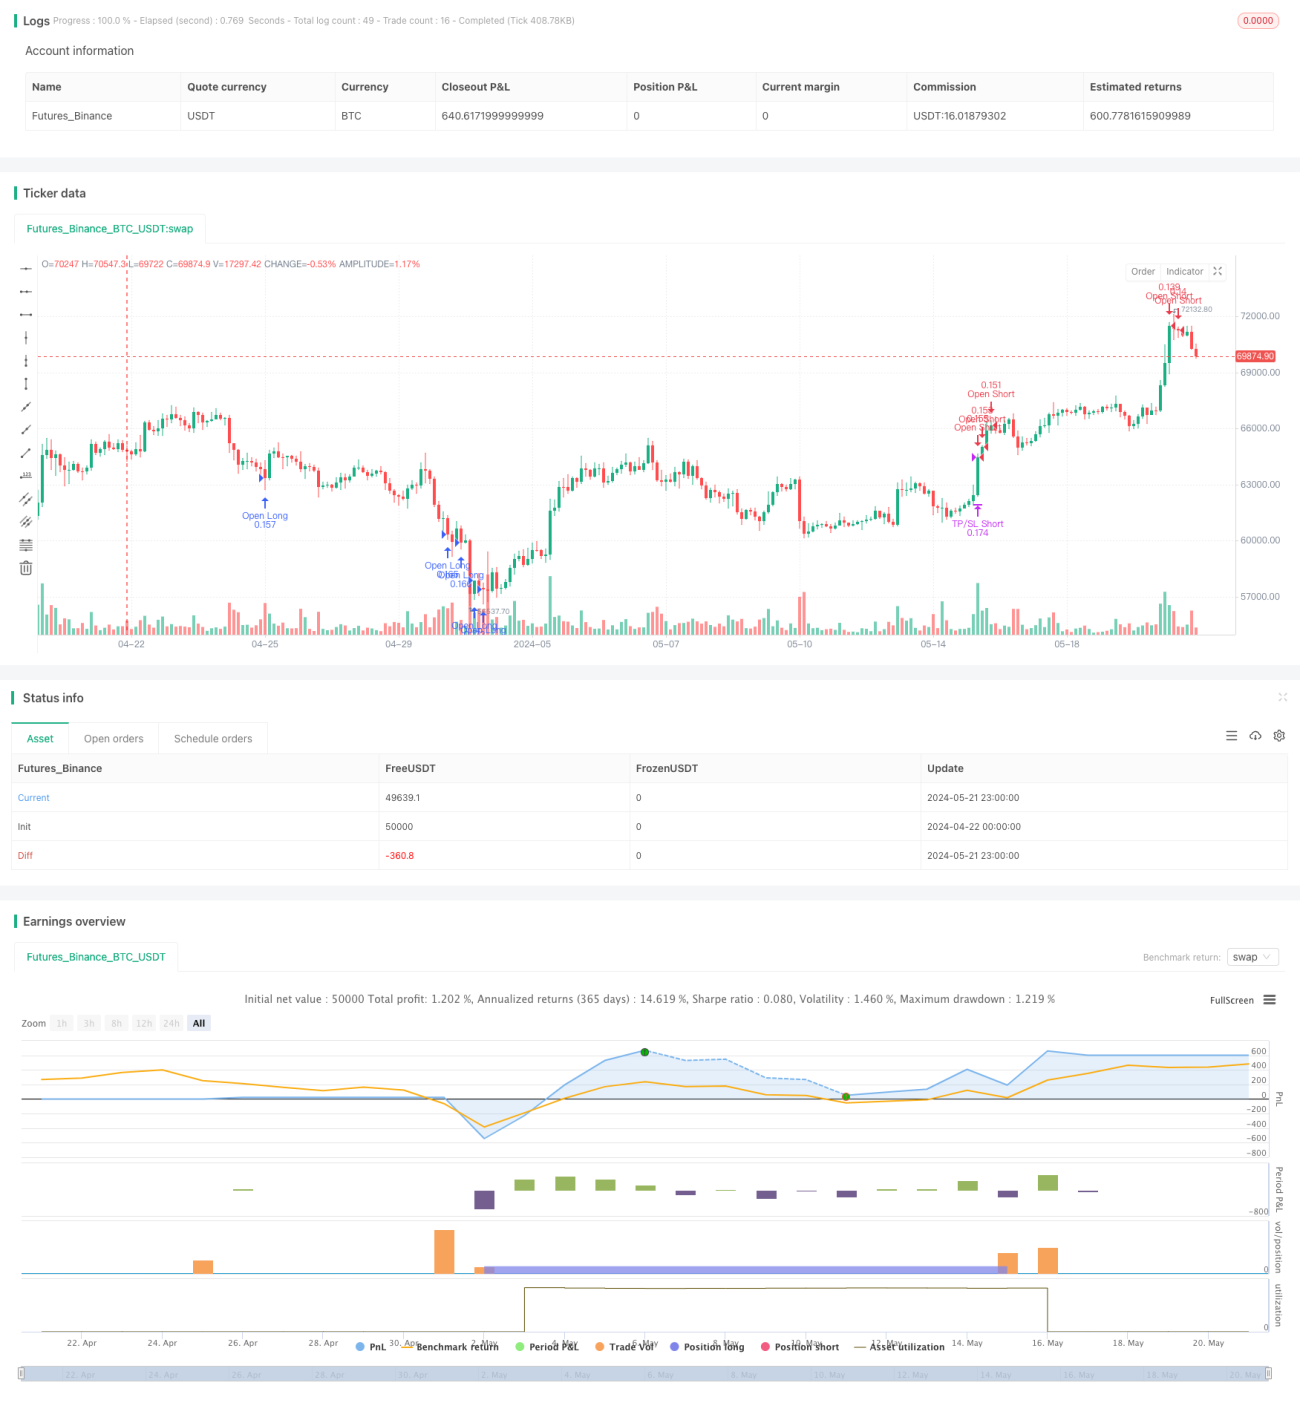
/*backtest
start: 2024-04-22 00:00:00
end: 2024-05-22 00:00:00
period: 3h
basePeriod: 15m
exchanges: [{"eid":"Futures_Binance","currency":"BTC_USDT"}]
*/

//@version=5
strategy(title='Super Indicator 7 in 1', shorttitle='Super Indicator 7 in 1', overlay=true, initial_capital=100, pyramiding=0, default_qty_value=10000, default_qty_type=strategy.cash)

// Defining indicator parameters- 1