资源加载中... loading...

Bollinger Bands RSI Trading Strategy

Author: ChaoZhang, Date: 2024-05-24 17:24:06
Tags: RSIBBSMA

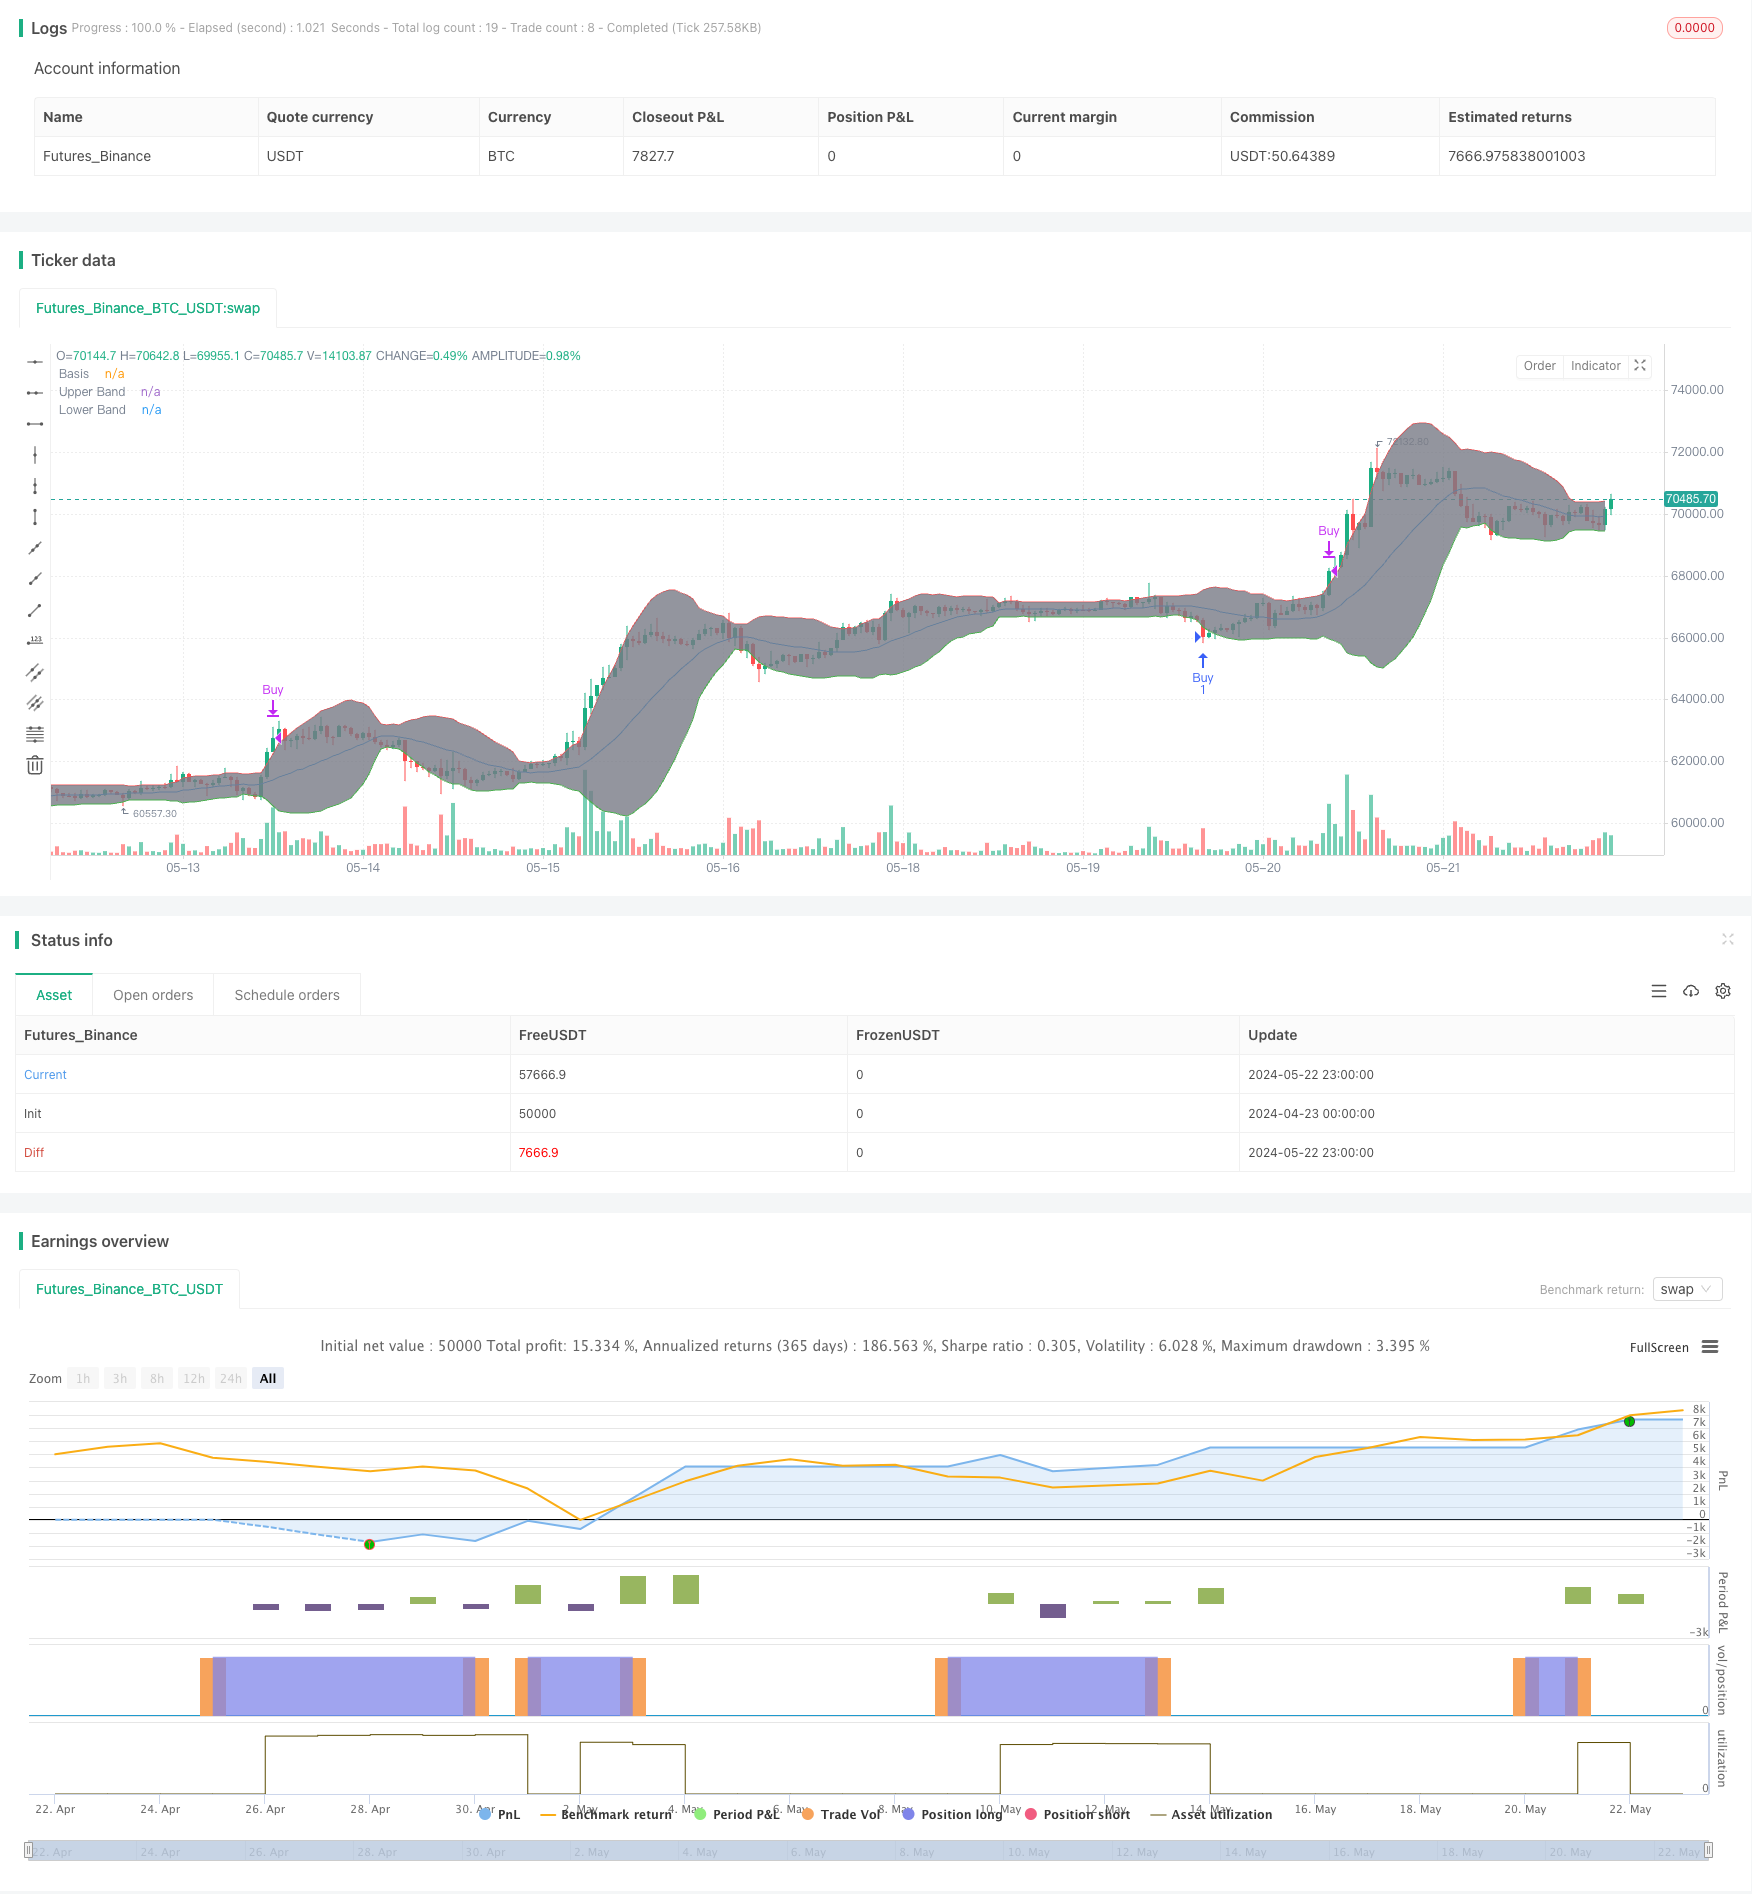
img

Overview

This strategy uses Bollinger Bands (BB) and the Relative Strength Index (RSI) to identify trading signals. When the price breaks through the upper or lower Bollinger Band and the RSI is above the overbought level or below the oversold level, a buy or sell signal is generated. The strategy aims to capture extreme price movements and uses RSI to confirm the strength of the trend.

Strategy Principles

  1. Calculate the upper, middle, and lower Bollinger Bands. The upper and lower bands are the middle band plus or minus a multiple of the standard deviation.
  2. Calculate the RSI indicator to measure overbought and oversold price conditions.
  3. When the closing price is below the lower Bollinger Band and the RSI is below the oversold level, a buy signal is generated.
  4. When the closing price is above the upper Bollinger Band and the RSI is above the overbought level, a sell signal is generated.
  5. Execute buy and sell orders and close positions when the opposite signal appears.

Strategy Advantages

  1. Combines price and momentum indicators to improve the reliability of trading signals.
  2. Bollinger Bands can dynamically adjust to adapt to different market volatilities.
  3. RSI can confirm the strength of the trend and avoid generating too many trading signals in a sideways market.
  4. The strategy logic is clear and easy to implement and optimize.

Strategy Risks

  1. In a market with unclear trends or low volatility, the strategy may generate many false signals.
  2. The selection of parameters for RSI and Bollinger Bands has a significant impact on strategy performance, and inappropriate parameters may lead to poor performance.
  3. The strategy does not consider transaction costs and slippage, which may affect the actual returns.

Strategy Optimization Directions

  1. Optimize the parameters of Bollinger Bands (e.g., length and standard deviation multiple) and RSI (e.g., length and overbought/oversold thresholds) to improve the adaptability and stability of the strategy.
  2. Introduce other technical indicators or filtering conditions, such as trend confirmation indicators or volume indicators, to further improve the quality of trading signals.
  3. Consider transaction costs and slippage, set reasonable stop-loss and take-profit levels to control risks and improve the actual returns of the strategy.
  4. Backtest the strategy and optimize parameters, and test the strategy under different market conditions to assess its robustness.

Summary

The Bollinger Bands RSI Trading Strategy generates trading signals by combining price and momentum indicators when prices experience extreme fluctuations. The strategy’s advantages lie in its clear logic and ease of implementation and optimization. However, the performance of the strategy depends on parameter selection and may generate many false signals in certain market environments. By optimizing parameters, introducing other indicators, and considering actual transaction costs, the robustness and profit potential of the strategy can be further improved.


/*backtest
start: 2024-04-23 00:00:00
end: 2024-05-23 00:00:00
period: 1h
basePeriod: 15m
exchanges: [{"eid":"Futures_Binance","currency":"BTC_USDT"}]
*/

//@version=5
strategy("Bollinger Bands + RSI Strategy", overlay=true)

// Bollinger Bands settings
length = input.int(20, title="BB Length")
src = close
mult = input.float(2.0, title="BB Multiplier")

basis = ta.sma(src, length)
dev = mult * ta.stdev(src, length)
upper = basis + dev
lower = basis - dev

// Plot Bollinger Bands
plot(basis, color=color.blue, title="Basis")
p1 = plot(upper, color=color.red, title="Upper Band")
p2 = plot(lower, color=color.green, title="Lower Band")
fill(p1, p2, color=color.gray, transp=90)

// RSI settings
rsiLength = input.int(14, title="RSI Length")
rsiOverbought = input.int(70, title="RSI Overbought Level")
rsiOversold = input.int(30, title="RSI Oversold Level")

rsi = ta.rsi(close, rsiLength)

// Buy and sell conditions
buyCondition = (close < lower) and (rsi < rsiOversold)
sellCondition = (close > upper) and (rsi > rsiOverbought)

// Execute buy and sell orders
if (buyCondition)
    strategy.entry("Buy", strategy.long)

if (sellCondition)
    strategy.close("Buy")
template: strategy.tpl:40:21: executing "strategy.tpl" at <.api.GetStrategyListByName>: wrong number of args for GetStrategyListByName: want 7 got 6