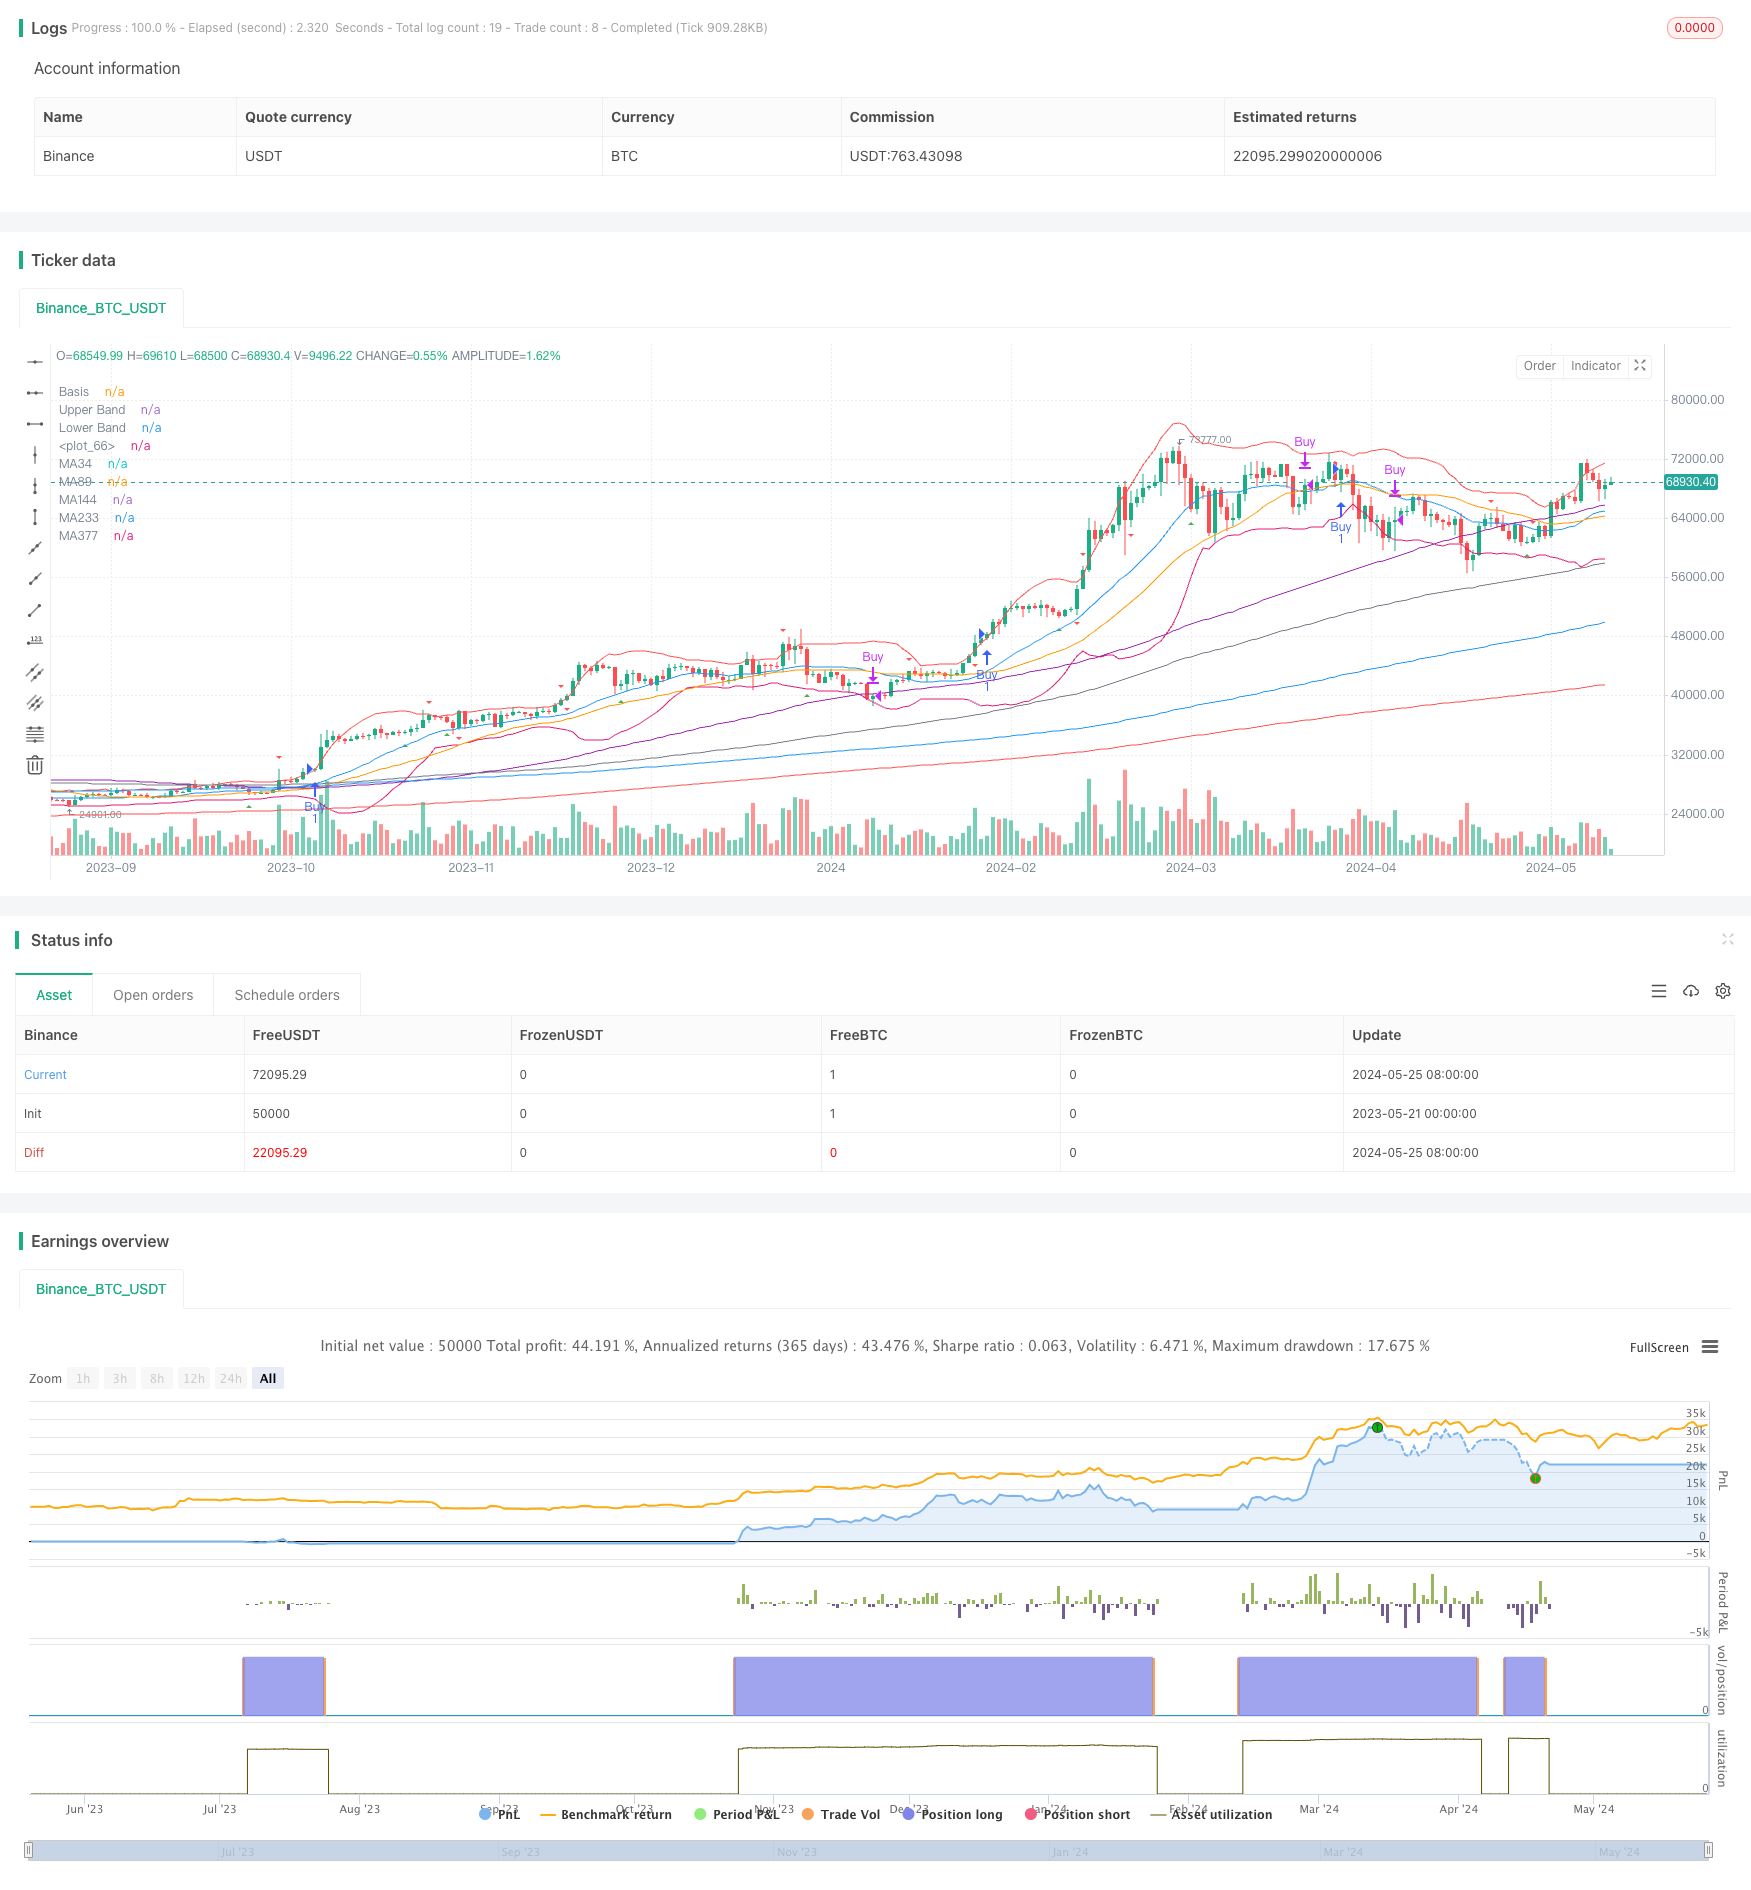
概述
该策略结合布林带、RSI、多条移动平均线和MACD指标,构建了一个完整的交易系统。首先通过布林带来判断价格的波动情况,并利用价格相对布林带中轨的位置来确定趋势。同时使用RSI指标来判断超买超卖情况,利用RSI背离来识别潜在的趋势反转。多条移动平均线用于趋势跟踪和支撑阻力位判断。最后MACD指标也用于辅助判断趋势和潜在反转。综合以上指标来制定开平仓条件,构建完整的交易策略。
策略原理
- 使用20周期、2倍标准差的布林带,通过收盘价相对布林带中轨的位置来判断趋势。
- 计算14周期RSI,并通过RSI与30和70水平的交叉来判断超卖和超买,识别潜在反转。
- 计算34、89、144、233、377和610周期的简单移动平均线,通过均线的多头排列来确认趋势,均线也可作为支撑阻力位。
- 基于12、26、9参数计算MACD指标,并通过MACD柱状图与0轴的交叉来辅助判断趋势反转。
- 综合判断以上指标,制定开平仓逻辑:
- 开仓:当收盘价在布林带中轨上方,且短期均线在长期均线上方时开多仓。
- 平仓:当收盘价跌破布林带中轨时平一半仓位,当短期均线跌破长期均线时平全部仓位。
策略优势
- 布林带能够客观量化价格的波动情况,为趋势判断提供依据。
- 引入RSI指标有助于判断超买超卖行情,捕捉潜在的趋势反转机会。
- 多条均线的组合能够更全面地分析各个时间尺度下的趋势情况。
- MACD指标可作为趋势和反转的辅助判断,提高信号的可靠性。
- 开平仓逻辑中加入了仓位管理的思路,在趋势不确定时逐步降低仓位以控制风险。
策略风险
- 在震荡行情下,布林带和均线系统可能产生频繁且相互矛盾的信号。
- RSI和MACD指标在强趋势行情下可能长期维持在超买超卖区,失去判断力。
- 参数选择(如布林带周期、均线周期等)具有一定主观性,不同参数可能带来不同结果。
- 缺乏止损机制可能导致单笔交易的风险放大。
- 对于黑天鹅等极端行情可能无法及时应对,产生较大回撤。
策略优化方向
- 对各项指标的参数进行更系统的优化,如布林带的周期和宽度、RSI的周期和阈值等。
- 引入更多确认信号,如成交量变化等,提高信号的可靠性。
- 在开平仓条件中引入止损和止盈机制,更好地控制单笔交易风险。
- 考虑引入仓位调整机制,在不同的市场情况下灵活调整仓位,提高收益风险比。
- 对于极端行情设计应对预案,如基于VIX指数等对冲或对Alpha因子进行动态加权。
总结
该策略从多个维度出发构建了一个较为完善的交易系统,包括趋势判断、超买超卖判断、多时间尺度分析、仓位控制等。但策略在应对震荡行情、极端行情时还有待优化,同时缺乏更系统的参数优化和风险控制。未来可朝着更精细的信号筛选、动态权重调整、极端行情应对等方面继续改进。通过不断的回测优化和实盘检验,该策略有望成长为一个稳健且可持续的量化交易策略。
策略源码
/*backtest
start: 2023-05-21 00:00:00
end: 2024-05-26 00:00:00
period: 1d
basePeriod: 1h
exchanges: [{"eid":"Binance","currency":"BTC_USDT"}]
*/

//@version=5
strategy("Bollinger Bands + RSI Strategy with MA", overlay=true)

// Bollinger Bands
length = input.int(20, title="BB Length")
mult = input.float(2.0, title="BB Mult")
basis = ta.sma(close, length)
dev = mult * ta.stdev(close, length)
upper_band = basis + dev
lower_band = basis - dev

// RSI
rsi_length = input.int(14, title="RSI Length")
rsi_oversold = input.int(30, title="RSI Oversold", minval=0, maxval=100)
rsi_overbought = input.int(70, title="RSI Overbought", minval=0, maxval=100)
rsi = ta.rsi(close, rsi_length)

// RSI Divergence
rsi_divergence_bottom = ta.crossunder(rsi, rsi_oversold)
rsi_divergence_peak = ta.crossunder(rsi_overbought, rsi)

// Moving Averages
ma34 = ta.sma(close, 34)
ma89 = ta.sma(close, 89)
ma144 = ta.sma(close, 144)
ma233 = ta.sma(close, 233)
ma377 = ta.sma(close, 377)
ma610 = ta.sma(close, 610)

// MACD Calculation
[macd_line, signal_line, _] = ta.macd(close, 12, 26, 9)
macd_histogram = macd_line - signal_line

// MACD Divergence
macd_divergence_bottom = ta.crossunder(macd_histogram, 0)
macd_divergence_peak = ta.crossover(macd_histogram, 0)

// Conditions for Buy and Sell
basis_gt_ma34 = basis > ma34
ma34_gt_ma89 = ma34 > ma89

// Entry condition
buy_condition = basis_gt_ma34 and ma34_gt_ma89
sell_condition =  basis <ma34

// Calculate position size
position_size = 1.0  // 100% capital initially

// Update position size based on conditions
if (sell_condition)
    position_size := 0.5  // Sell half of the position
if (not basis_gt_ma34)
    position_size := 0.0  // Sell all if basis < ma34

// Entry and exit strategy
if (buy_condition)
    strategy.entry("Buy", strategy.long, qty=position_size)
if (sell_condition)
    strategy.close("Buy")

// Plot Bollinger Bands and Moving Averages
bb_fill_color = basis > basis[1] ? color.new(color.blue, 90) : color.new(color.blue, 10)
plot(basis, color=color.blue, title="Basis")
plot(upper_band, color=color.red, title="Upper Band")
plot(lower_band, color=color.green, title="Lower Band")
fill(plot1=plot(upper_band), plot2=plot(lower_band), color=bb_fill_color, title="BB Fill")
plot(ma34, color=color.orange, title="MA34")
plot(ma89, color=color.purple, title="MA89")
plot(ma144, color=color.gray, title="MA144")
plot(ma233, color=color.blue, title="MA233")
plot(ma377, color=color.red, title="MA377")
plot(ma610, color=color.green, title="MA610")

// Plot RSI Divergence
plotshape(series=rsi_divergence_bottom, style=shape.triangleup, location=location.abovebar, color=color.green, size=size.small)
plotshape(series=rsi_divergence_peak, style=shape.triangledown, location=location.belowbar, color=color.red, size=size.small)

// Plot MACD Histogram Divergence
plotshape(series=macd_divergence_bottom, style=shape.triangleup, location=location.belowbar, color=color.green, size=size.small)
plotshape(series=macd_divergence_peak, style=shape.triangledown, location=location.abovebar, color=color.red, size=size.small)
相关推荐