资源加载中... loading...

MA,SMA Dual Moving Average Crossover Strategy

Author: ChaoZhang, Date: 2024-05-28 10:53:02
Tags: MASMA

img

Overview

This strategy uses two moving averages (MAs) with different periods to generate trading signals. When the short-term MA crosses above the long-term MA from below, it generates a buy signal; when the short-term MA crosses below the long-term MA from above, it generates a sell signal. The main idea behind this strategy is to utilize the trend-tracking characteristics of MAs and capture trend changes through MA crossovers for trading purposes.

Strategy Principle

  1. Calculate two moving averages (MAs) with different periods: a short-term MA and a long-term MA.
  2. When the short-term MA crosses above the long-term MA from below, it indicates a potential uptrend formation and generates a buy signal.
  3. When the short-term MA crosses below the long-term MA from above, it indicates a potential downtrend formation and generates a sell signal.
  4. Trade based on the buy and sell signals: open a long position when a buy signal appears, and open a short position when a sell signal appears.

Strategy Advantages

  1. Simplicity: The strategy logic is clear, easy to understand, and implement.
  2. Trend tracking: By capturing trend changes through MA crossovers, the strategy can adapt well to different market trends.
  3. Parameter flexibility: The period parameters of the short-term and long-term MAs can be adjusted based on different markets and time frames to optimize strategy performance.

Strategy Risks

  1. Choppy markets: In choppy markets, frequent MA crossovers may lead to many false signals, resulting in more losing trades.
  2. Trend lag: MAs are lagging indicators, so the strategy may miss some profits at the beginning of a trend change.
  3. Parameter optimization: Different parameter settings can significantly affect strategy performance, and parameter optimization requires a large amount of historical data and computational resources.

Strategy Optimization Directions

  1. Add trend filters: After an MA crossover generates a signal, other trend indicators (such as MACD, DMI, etc.) can be used for secondary confirmation to filter out some false signals.
  2. Optimize take profit and stop loss: Reasonably setting take profit and stop loss levels can minimize losses and let profits run in case of trend delays.
  3. Dynamic parameter optimization: Dynamically adjust MA period parameters based on different market conditions to adapt to current market characteristics.
  4. Combine with other signals: Combine MA crossover signals with other technical indicators (such as RSI, Bollinger Bands, etc.) to form more reliable trading signals.

Summary

The dual moving average crossover strategy is a simple and easy-to-use trend-tracking strategy that captures trend changes through the crossover of two MAs with different periods. The strategy’s advantages are clear logic, explicit signals, and suitability for trending markets. However, in choppy markets, the strategy may generate more false signals and losing trades. Therefore, in practical applications, the strategy’s performance can be improved by adding trend filters, optimizing take profit and stop loss, dynamically optimizing parameters, and combining with other signals to enhance its adaptability and stability.


/*backtest
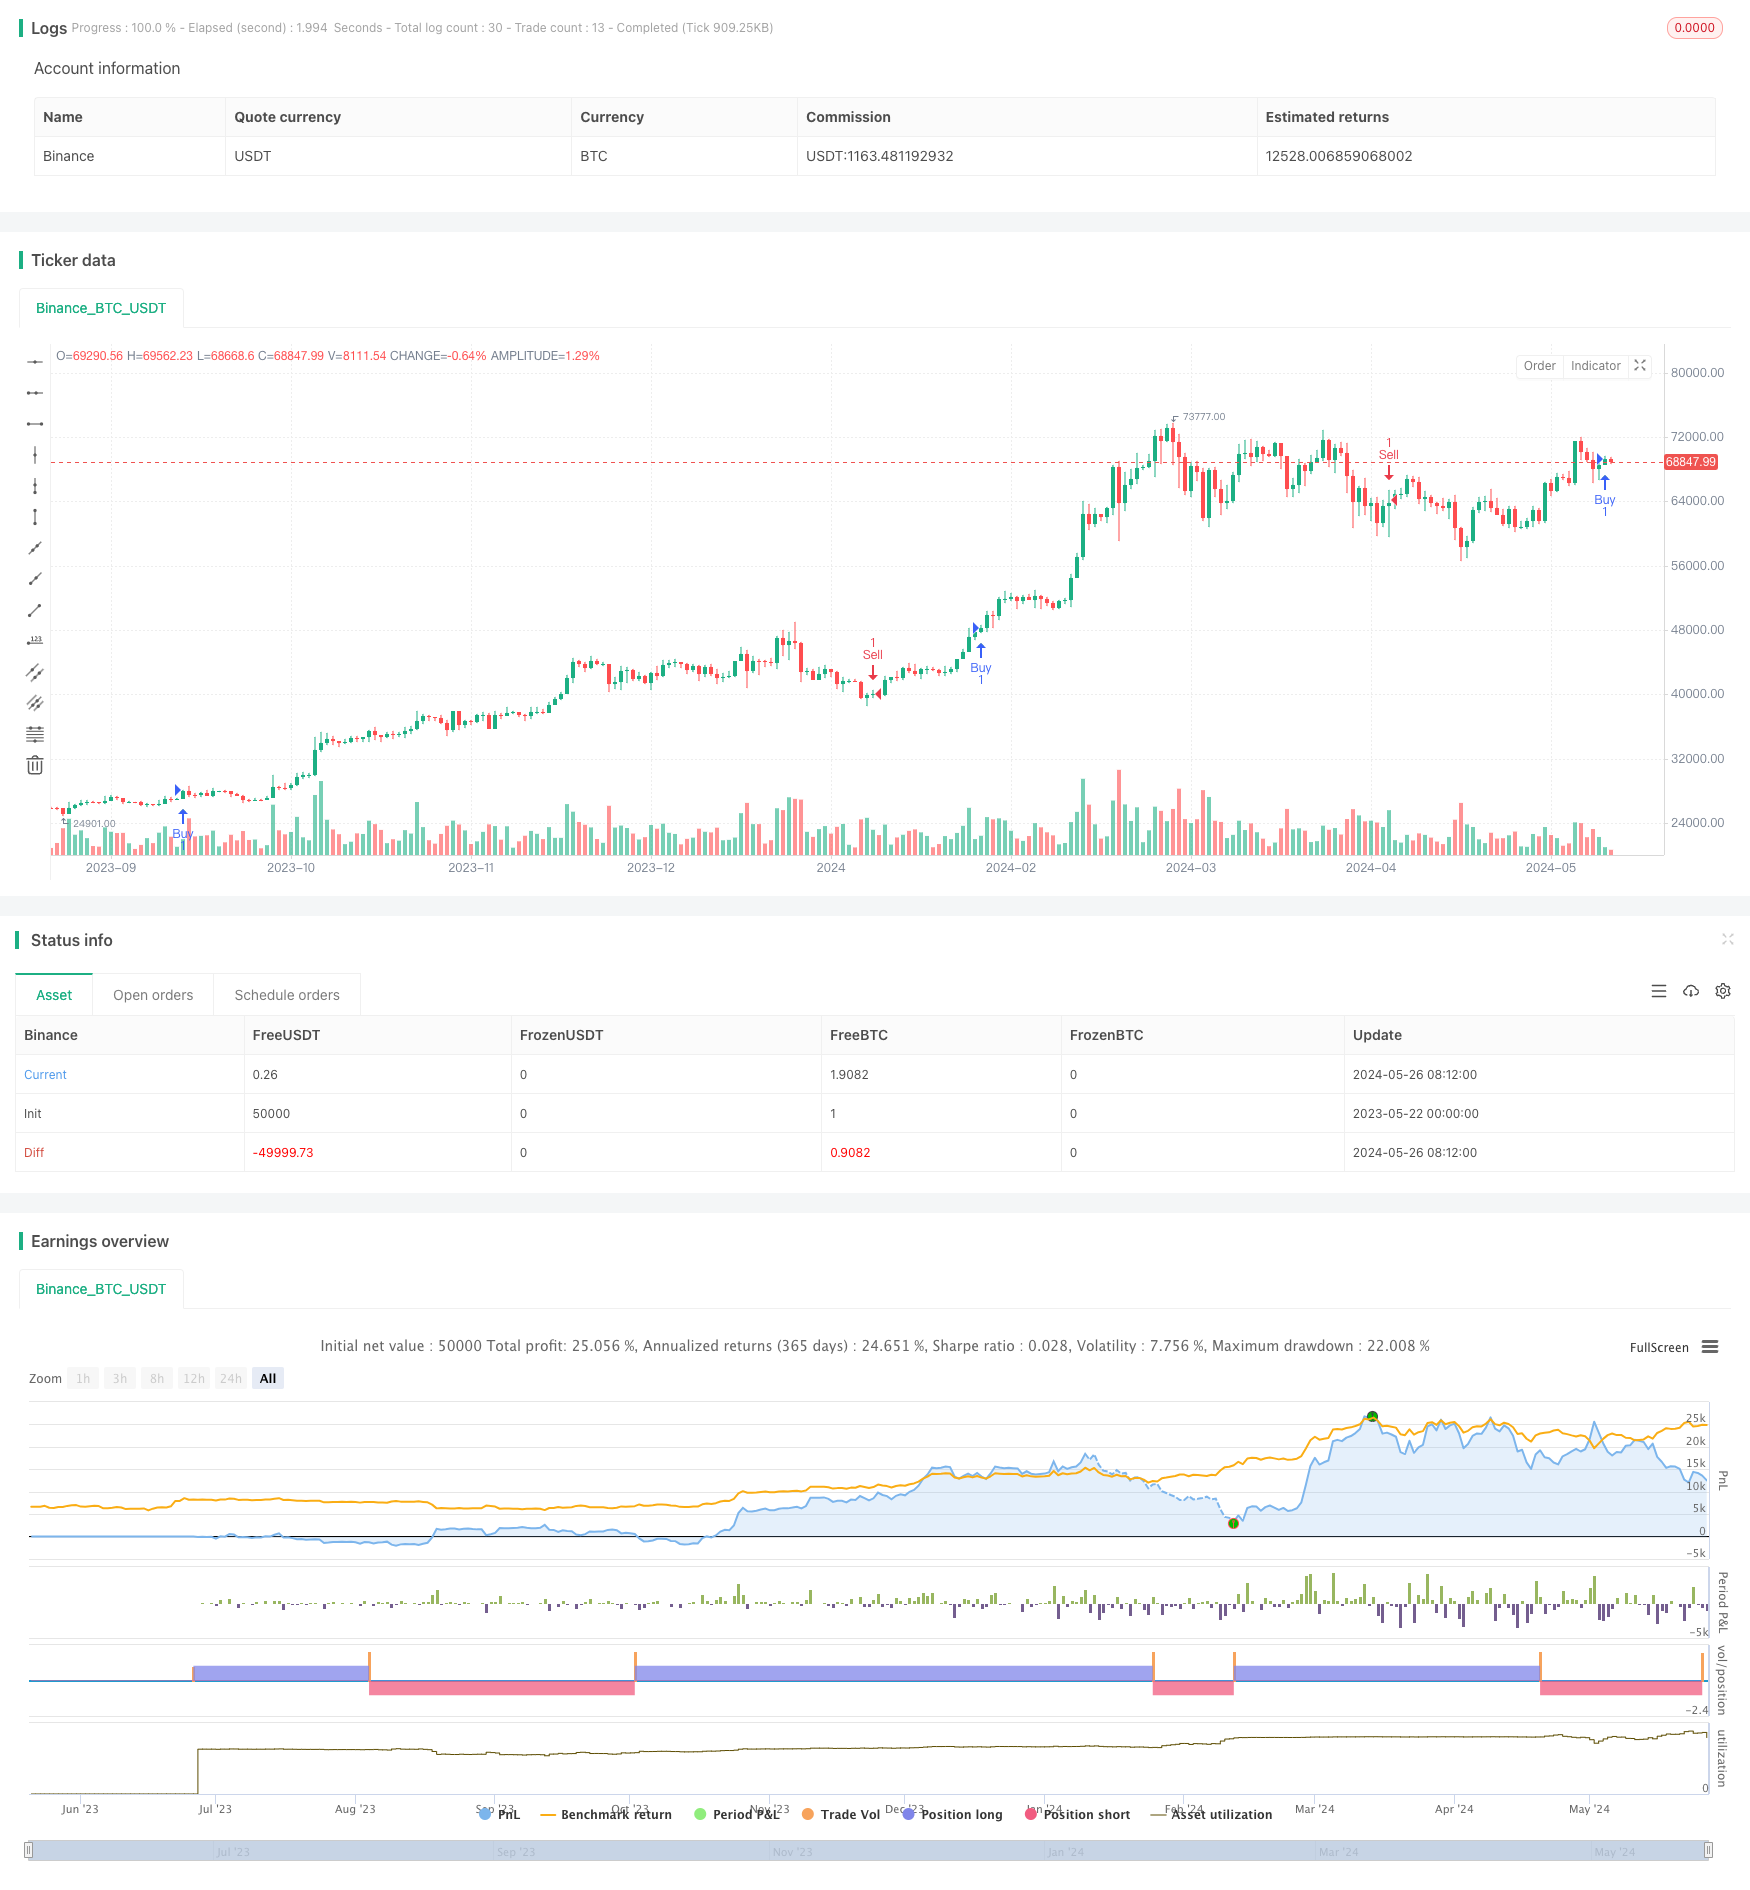
start: 2023-05-22 00:00:00
end: 2024-05-27 00:00:00
period: 1d
basePeriod: 1h
exchanges: [{"eid":"Binance","currency":"BTC_USDT"}]
*/

//@version=5
strategy("Combined Strategy", overlay=true)

// Moving Averages Length Inputs
short_length = input.int(20, "Short MA Length")
long_length = input.int(50, "Long MA Length")

// Moving Averages
ma_short = ta.sma(close, short_length)
ma_long = ta.sma(close, long_length)

// Buy Condition (Moving Average Crossover)
buy_condition = ta.crossover(ma_short, ma_long)
plotshape(series=buy_condition, style=shape.triangleup, location=location.belowbar, color=color.green, size=size.small)

// Sell Condition (Moving Average Crossover)
sell_condition = ta.crossunder(ma_short, ma_long)
plotshape(series=sell_condition, style=shape.triangledown, location=location.abovebar, color=color.red, size=size.small)

// Strategy Entry and Exit
if (buy_condition)
    strategy.entry("Buy", strategy.long)

if (sell_condition)
    strategy.entry("Sell", strategy.short)

// Debug statements
if (buy_condition)
    label.new(x=bar_index, y=low, text="Buy Signal", color=color.green, style=label.style_label_up)

if (sell_condition)
    label.new(x=bar_index, y=high, text="Sell Signal", color=color.red, style=label.style_label_down)

template: strategy.tpl:40:21: executing "strategy.tpl" at <.api.GetStrategyListByName>: wrong number of args for GetStrategyListByName: want 7 got 6