概述
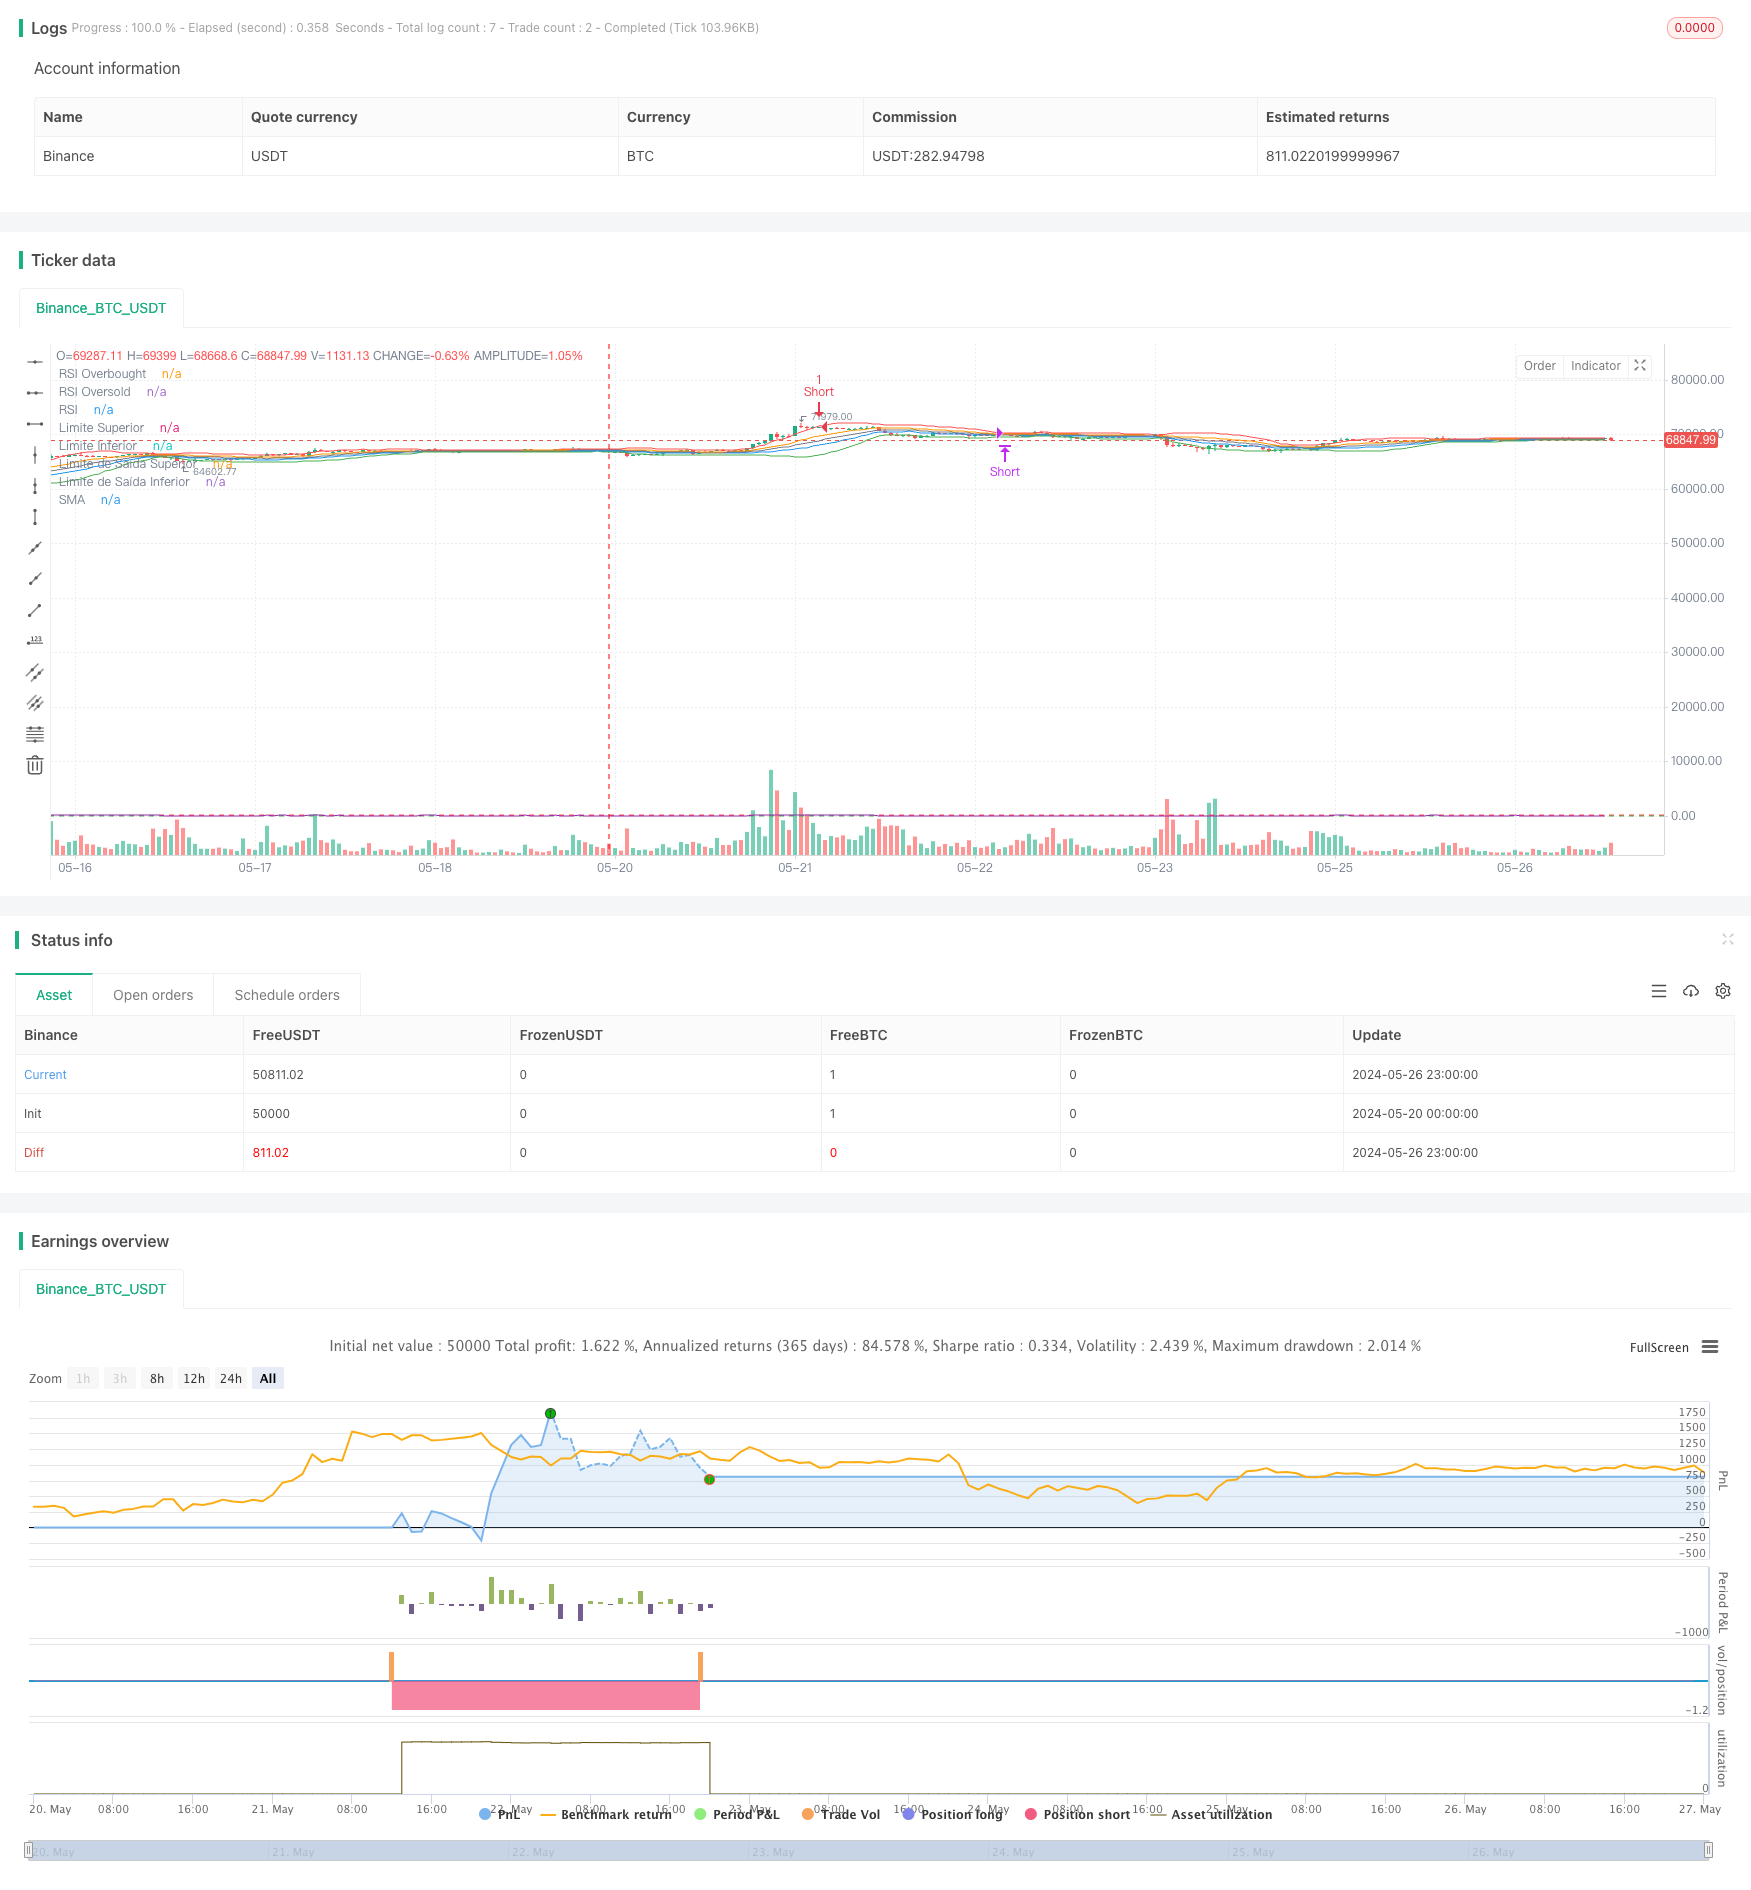
这个Pine Script策略基于相对强弱指数RSI和价格的波动率标准差DEV,通过比较价格与上下轨道来判断进场点,同时使用RSI作为辅助过滤指标,在价格触及上下轨道且RSI达到超买超卖区间时产生开仓信号,当价格反向突破退出轨道或RSI反向达到超买超卖区间时平仓。该策略能够根据市场波动情况动态调整,在波动率较高时及时止损,波动率较低时持仓获利,是一个能够适应不同市场状态的量化交易策略。
策略原理
- 计算价格在过去length个周期内的滑动平均SMA和标准差DEV。
- 以SMA为中轴,SMA+thresholdEntry*DEV为上轨,SMA-thresholdEntry*DEV为下轨,构建波动率通道。
- 同时计算过去rsiLength个周期收盘价的RSI指标。
- 当价格向上突破下轨且RSI小于超卖阈值rsiOversold时,产生开多仓信号。
- 当价格向下突破上轨且RSI大于超买阈值rsiOverbought时,产生开空仓信号。
- 以SMA为中轴,SMA+thresholdExit*DEV为上轨,SMA-thresholdExit*DEV为下轨,构建另一个较窄的退出通道。
- 当持多仓时,如果价格向下突破退出下轨或RSI大于超买阈值,平多仓。
- 当持空仓时,如果价格向上突破退出上轨或RSI小于超卖阈值,平空仓。
优势分析
- 同时使用价格行为和动量指标辅助判断,可以有效过滤假信号。
- 通过波动率动态调整通道宽度,使策略能够适应不同的市场状态。
- 设置两套通道,在价格反转初期即可止损,控制回撤,同时在趋势形成后仍能持仓获利。
- 代码逻辑和参数设置清晰明了,容易理解和优化。
风险分析
- 当市场持续单边趋势运行时,该策略可能会过早止损,错失趋势利润。
- 参数设置对策略表现影响很大,针对不同品种和周期需要分别进行参数优化。
- 策略在震荡市更有优势,趋势市表现一般。若长期趋势突然反转,该策略可能会产生较大回撤。
- 如果标的资产波动率发生剧烈变化,固定的参数设置可能会失效。
优化方向
- 可以尝试引入趋势判断指标,如长短期均线交叉、ADX等,对趋势和震荡市进行区分,使用不同的参数设置。
- 考虑使用适应性更强的波动率指标,如ATR,对波动率通道宽度进行动态调整。
- 在开仓前对价格走势进行趋势判断,检测是否处于明确的趋势中,避免逆势交易。
- 可以通过遗传算法、网格搜索等方法对不同参数组合进行优化,寻找最佳的参数设置。
- 考虑分别针对多头和空头仓位使用不同的参数设置,控制风险敞口。
总结
该策略通过波动率通道和相对强弱指数相结合的方式,在价格波动的同时参考RSI指标进行开平仓判断,能够较好地把握阶段性趋势,及时止损和获利了结。但是策略的表现对参数设置比较敏感,需要针对不同市场环境和标的资产进行优化,同时考虑引入其他指标对市场趋势进行辅助判断,才能充分发挥该策略的优势。总的来说,该策略思路清晰,逻辑严谨,是一个不错的量化交易策略。
策略源码
/*backtest
start: 2024-05-20 00:00:00
end: 2024-05-27 00:00:00
period: 1h
basePeriod: 15m
exchanges: [{"eid":"Binance","currency":"BTC_USDT"}]
*/

// This Pine Script™ code is subject to the terms of the Mozilla Public License 2.0 at https://mozilla.org/MPL/2.0/
// © tmalvao

//@version=5
strategy("Estratégia de Desvio Padrão com RSI", overlay=true, margin_long=100, margin_short=100)

// Parâmetros
length = input.int(20, title="Período do Desvio Padrão")
thresholdEntry = input.float(1.5, title="Limite de Entrada")
thresholdExit = input.float(0.5, title="Limite de Saída")
rsiLength = input.int(14, title="Período do RSI")
rsiOverbought = input.int(70, title="RSI Overbought")
rsiOversold = input.int(30, title="RSI Oversold")

// Cálculo do Desvio Padrão
price = close
stdDev = ta.stdev(price, length)

// Média Móvel Simples
sma = ta.sma(price, length)

// Limites baseados no Desvio Padrão
upperLimit = sma + thresholdEntry * stdDev
lowerLimit = sma - thresholdEntry * stdDev
exitUpperLimit = sma + thresholdExit * stdDev
exitLowerLimit = sma - thresholdExit * stdDev

// Cálculo do RSI
rsi = ta.rsi(price, rsiLength)

// Condições de Entrada com RSI
longCondition = ta.crossover(price, lowerLimit) and rsi < rsiOversold
shortCondition = ta.crossunder(price, upperLimit) and rsi > rsiOverbought

// Condições de Saída com RSI
exitLongCondition = ta.crossunder(price, exitLowerLimit) or rsi > rsiOverbought
exitShortCondition = ta.crossover(price, exitUpperLimit) or rsi < rsiOversold

// Plotar Linhas
plot(upperLimit, color=color.red, title="Limite Superior")
plot(lowerLimit, color=color.green, title="Limite Inferior")
plot(exitUpperLimit, color=color.orange, title="Limite de Saída Superior")
plot(exitLowerLimit, color=color.blue, title="Limite de Saída Inferior")
plot(sma, color=color.gray, title="SMA")
hline(rsiOverbought, "RSI Overbought", color=color.red)
hline(rsiOversold, "RSI Oversold", color=color.green)
plot(rsi, title="RSI", color=color.purple)

// Estratégia de Trade
if (longCondition)
    strategy.entry("Long", strategy.long)

if (shortCondition)
    strategy.entry("Short", strategy.short)

if (exitLongCondition)
    strategy.close("Long")

if (exitShortCondition)
    strategy.close("Short")
相关推荐