概述
该策略使用快速移动平均线(EMA)和慢速移动平均线(EMA)的交叉,结合相对强弱指数(RSI)和趋势线突破来捕捉趋势性交易机会。当快速EMA上穿慢速EMA或价格突破上升趋势线,并且RSI低于超买水平时,策略会产生做多信号。相反,当快速EMA下穿慢速EMA或价格跌破下降趋势线,并且RSI高于超卖水平时,策略会产生做空信号。这种结合移动平均线、RSI和趋势线突破的方法可以有效捕捉趋势性行情,同时避免在震荡市中过早入场。
策略原理
- 计算快速EMA和慢速EMA,默认周期分别为10和30。
- 计算RSI指标,默认周期为14,并设定超买和超卖水平,默认为70和30。
- 通过比较当前收盘价与过去50个周期的最高价和最低价,判断是否发生趋势线突破。
- 当快速EMA上穿慢速EMA或价格突破上升趋势线,并且RSI低于超买水平时,产生做多信号。
- 当快速EMA下穿慢速EMA或价格跌破下降趋势线,并且RSI高于超卖水平时,产生做空信号。
- 在图表上绘制快速EMA、慢速EMA、RSI、超买超卖水平以及趋势线突破水平,并标记做多做空信号。
优势分析
- 结合移动平均线和RSI指标,可以更准确地判断趋势方向和动量强度。
- 加入趋势线突破概念,可以更好地捕捉趋势启动点,避免在震荡市中过早入场。
- 使用RSI超买超卖水平作为过滤条件,可以减少假突破带来的亏损交易。
- 参数可调,适用于不同的市场环境和交易风格。
风险分析
- 在趋势不明朗或市场波动剧烈时,该策略可能会产生较多的虚假信号。
- 策略依赖于历史数据,在市场发生重大变化或黑天鹅事件时,可能会失效。
- 没有设置止损和止盈条件,可能会面临单笔交易亏损过大的风险。
- 参数设置不当可能导致策略表现不佳,需要根据市场特点和个人风险偏好进行优化。
优化方向
- 引入更多技术指标,如MACD、布林带等,以提高信号准确性。
- 设置动态止损和止盈条件,如跟踪止损或基于ATR的止损,以更好地控制风险。
- 对参数进行优化,如使用遗传算法或网格搜索等方法,找到最佳参数组合。
- 结合基本面分析,如经济数据、政策变动等,以更全面地把握市场趋势。
总结
该策略通过结合EMA、RSI和趋势线突破,可以较为有效地捕捉趋势性交易机会。但同时也存在一定的风险,如虚假信号、历史数据依赖等。因此,在实际应用中,需要根据市场特点和个人风险偏好进行适当的优化和改进,如引入更多指标、设置动态止损止盈、优化参数等。此外,还可以结合基本面分析,以更全面地把握市场趋势,提高策略的稳健性和盈利能力。
策略源码
/*backtest
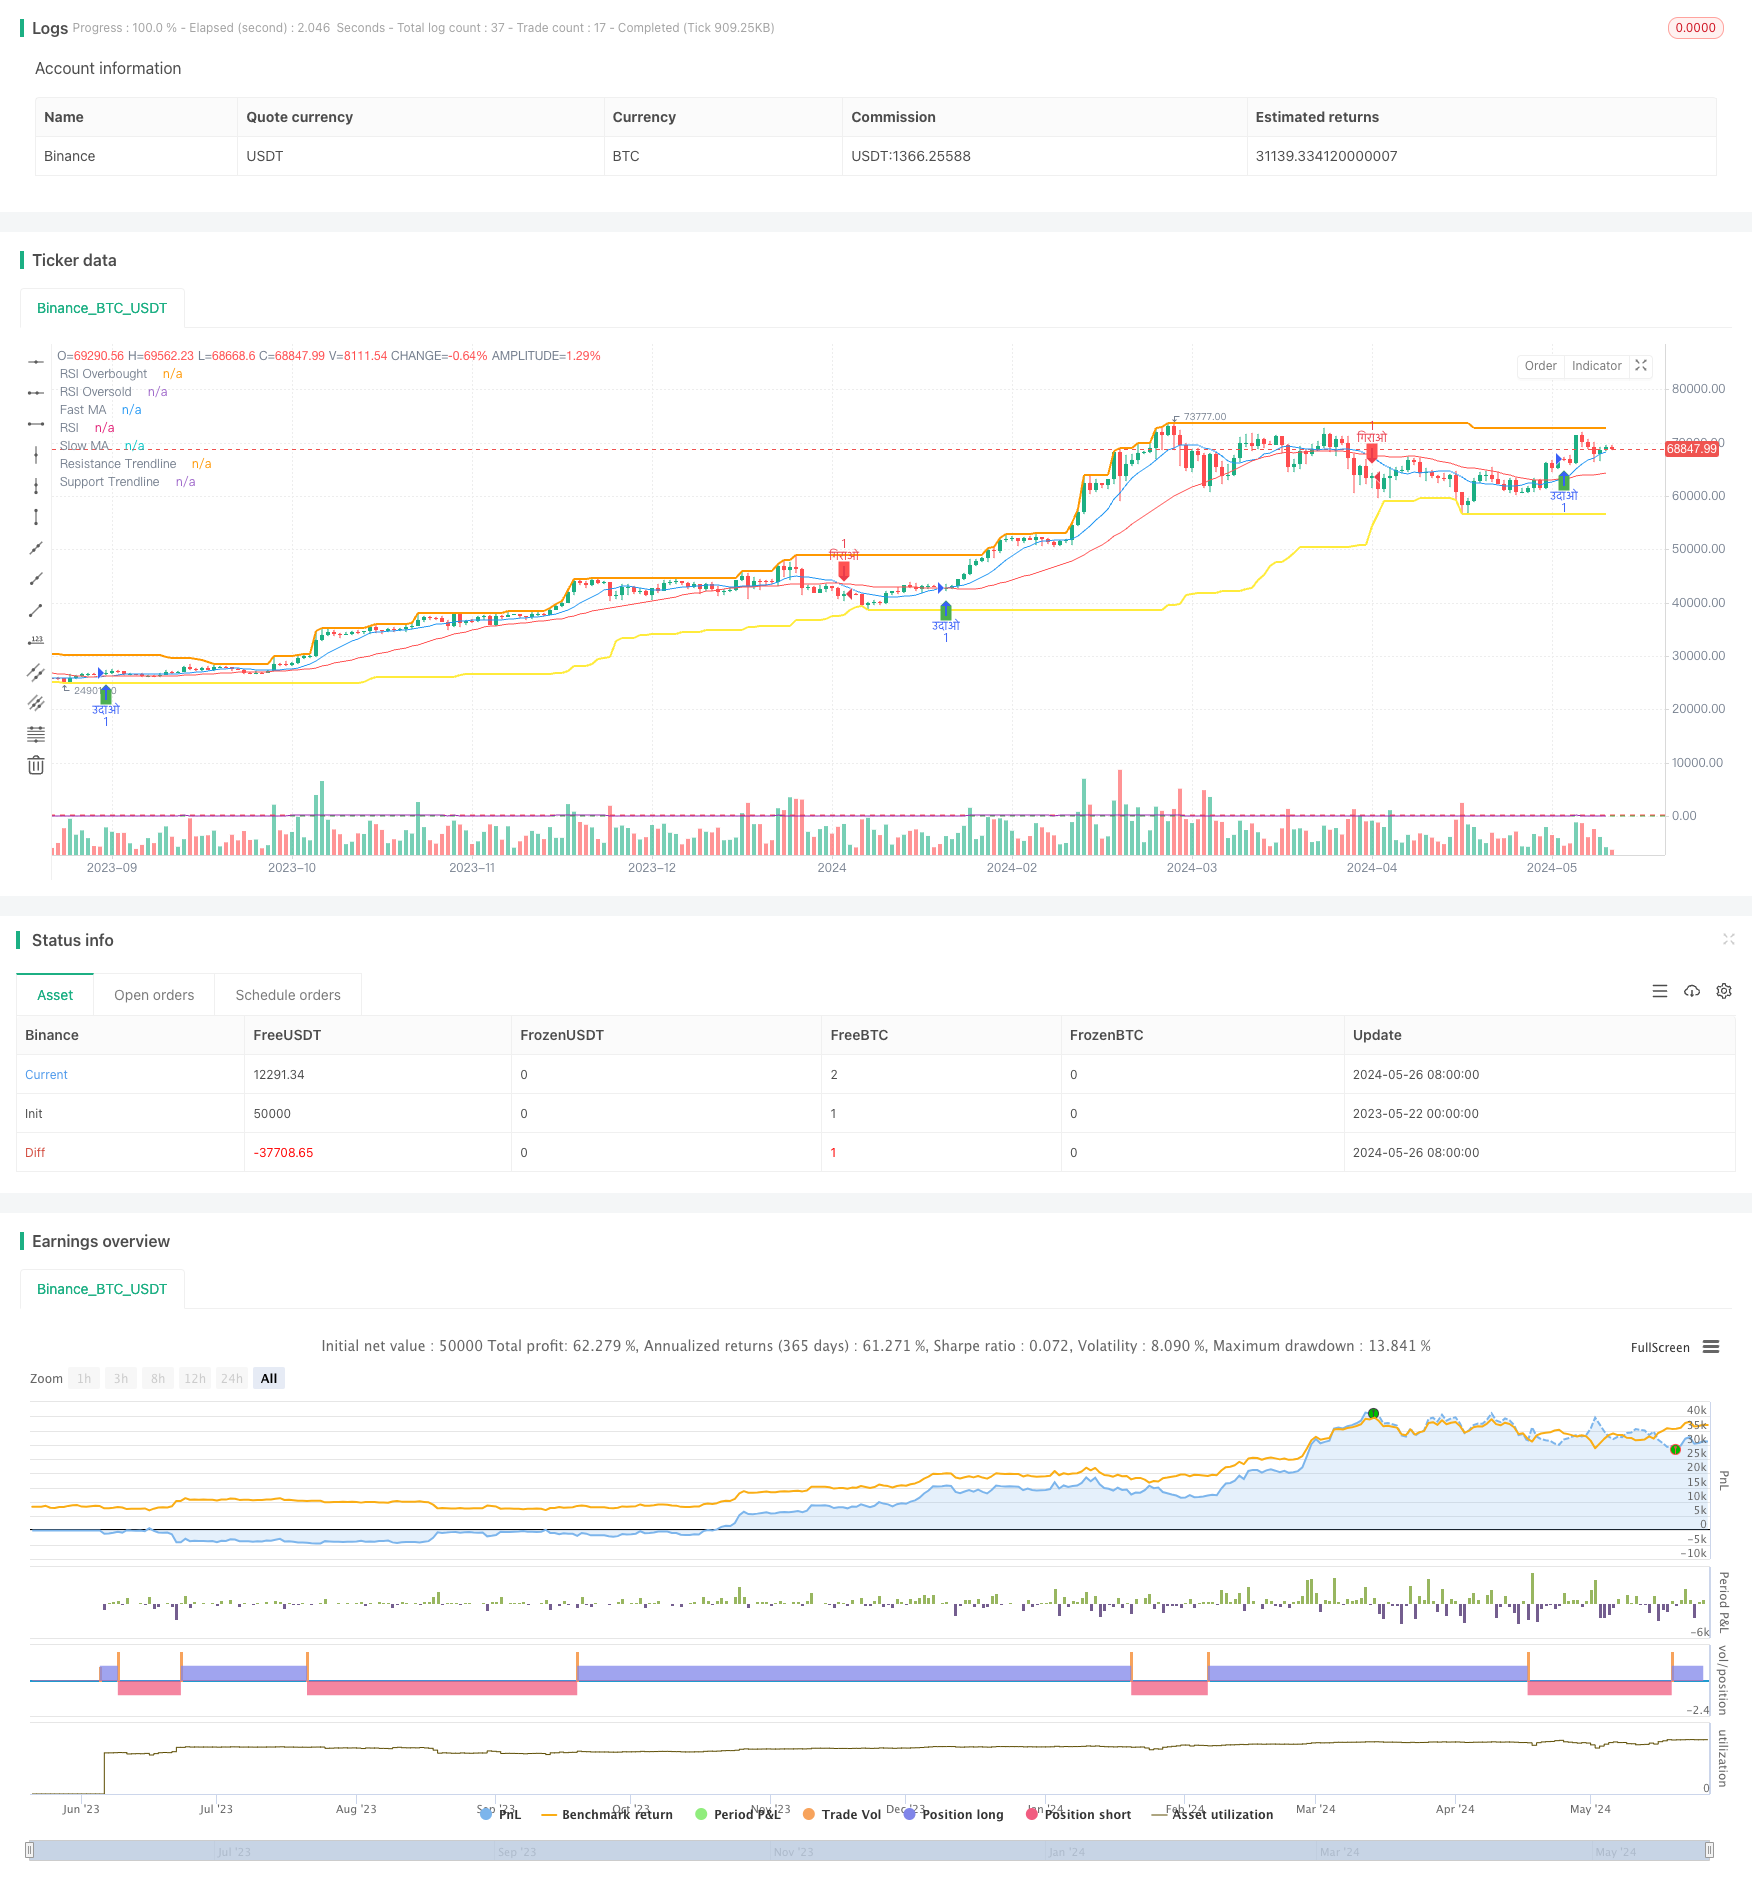
start: 2023-05-22 00:00:00
end: 2024-05-27 00:00:00
period: 1d
basePeriod: 1h
exchanges: [{"eid":"Binance","currency":"BTC_USDT"}]
*/
//@version=5
strategy("Gold Trading Strategy 15 min", overlay=true)
// Input parameters
fast_ma_length = input.int(10, title="Fast MA Length")
slow_ma_length = input.int(30, title="Slow MA Length")
rsi_length = input.int(14, title="RSI Length")
rsi_overbought = input.int(70, title="RSI Overbought Level")
rsi_oversold = input.int(30, title="RSI Oversold Level")
lookback = input.int(50, title="Trendline Lookback Period")
// Indicators
fast_ma = ta.sma(close, fast_ma_length)
slow_ma = ta.sma(close, slow_ma_length)
rsi = ta.rsi(close, rsi_length)
// Trendline breakout detection
highs = ta.highest(high, lookback)
lows = ta.lowest(low, lookback)
trendline_breakout_up = ta.crossover(close, highs)
trendline_breakout_down = ta.crossunder(close, lows)
// Entry conditions
udao_condition = (ta.crossover(fast_ma, slow_ma) or trendline_breakout_up) and rsi < rsi_overbought
girao_condition = (ta.crossunder(fast_ma, slow_ma) or trendline_breakout_down) and rsi > rsi_oversold
// Strategy execution
if (udao_condition)
strategy.entry("उदाओ", strategy.long)
if (girao_condition)
strategy.entry("गिराओ", strategy.short)
// Plotting
plot(fast_ma, color=color.blue, title="Fast MA")
plot(slow_ma, color=color.red, title="Slow MA")
hline(rsi_overbought, "RSI Overbought", color=color.red)
hline(rsi_oversold, "RSI Oversold", color=color.green)
plot(rsi, color=color.purple, title="RSI")
plotshape(series=udao_condition, location=location.belowbar, color=color.green, style=shape.labelup, title="उदाओ Signal")
plotshape(series=girao_condition, location=location.abovebar, color=color.red, style=shape.labeldown, title="गिराओ Signal")
// Plot trendline breakout levels
plot(highs, color=color.orange, linewidth=2, title="Resistance Trendline")
plot(lows, color=color.yellow, linewidth=2, title="Support Trendline")
相关推荐