资源加载中... loading...

Fibonacci Golden Harmony Breakout Strategy

Author: ChaoZhang, Date: 2024-05-28 13:56:59
Tags: EMAHMASMA

img

Overview

The Golden Harmony Breakout strategy aims to capture breakout trading opportunities by combining trendline analysis, Fibonacci retracement levels, and moving averages. The strategy first identifies crossovers and crossunders between the fast (9-period) and slow (21-period) EMAs, indicating potential trendline breakouts. Confirmation is then sought using the Fibonacci Golden Pocket, defined by the 61.8% and 65% retracement levels. Finally, the 200-day EMA and 300-day HMA provide further confirmation of the trend direction. When the price breaks through the Golden Pocket level and is confirmed by moving average crossovers, the strategy executes buy or sell trades.

Strategy Principles

  1. Identify Trendline Breakouts: Watch for crossovers and crossunders between the fast (9-period) and slow (21-period) EMAs, indicating potential trendline breakouts and shifts in market sentiment.
  2. Confirm with Fibonacci Levels: Once a breakout is identified, look for the appearance of the Golden Pocket, defined by the 61.8% and 65% Fibonacci retracement levels. These levels often act as significant support or resistance areas, providing additional confirmation of the breakout.
  3. Use Moving Averages for Confirmation: The 200-day EMA and 300-day HMA provide further confirmation of the trend direction. A bullish crossover of the price above these moving averages can strengthen the buy signal, while a bearish crossover can strengthen the sell signal.
  4. Execute Trades: When the price breaks through the Golden Pocket level and is confirmed by moving average crossovers, consider entering a long or short position.
  5. Manage Risk: Set stop-loss orders to limit potential losses and take-profit orders to secure profits. Consider using trailing stops to lock in gains as the trend progresses.
  6. Monitor Trade: Keep an eye on the trade as it progresses. Adjust stop-loss and take-profit levels based on market conditions and price action.

Strategy Advantages

  1. Multiple Confirmations: The strategy combines trendline analysis, Fibonacci levels, and moving averages to provide reliable signals for breakout trades. This multi-confirmation approach helps filter out false breakouts and improves the success rate of trades.
  2. Trend Following: By using moving averages to confirm the trend direction, the strategy allows traders to trade in line with the prevailing trend. This helps traders stay in the market during strong trends, maximizing profit potential.
  3. Risk Management: The strategy incorporates stop-loss and take-profit orders to manage risk and protect profits. This helps minimize potential losses while allowing profits to run. The use of trailing stops further optimizes the risk-reward ratio.

Strategy Risks

  1. False Breakouts: Despite the multi-confirmation approach, false breakout signals may still occur. This can lead to losing trades and capital losses. To mitigate this risk, traders can consider adding more confirmation factors or adjusting parameters to improve signal quality.
  2. Lagging Signals: As the strategy relies on lagging indicators such as moving averages and Fibonacci levels, signals may lag in fast-moving market conditions. This can result in delayed entries or missed profitable trading opportunities. To address this, traders can incorporate other leading indicators or price action patterns.
  3. Unexpected Events: Unforeseen market events or news can cause sudden price spikes, triggering stop-loss orders or leading to significant losses. To mitigate this risk, traders can use wider stop-loss placements or temporarily exit the market before major events.

Strategy Optimization Directions

  1. Parameter Optimization: The key parameters of the strategy, such as EMA periods, Fibonacci levels, and stop-loss placements, can be improved through backtesting and optimization. By systematically testing different parameter combinations, traders can determine the settings that best suit their market and trading style.
  2. Incorporating Additional Indicators: To enhance signal quality and confirmation, additional technical indicators can be incorporated into the strategy, such as the Relative Strength Index (RSI), Average True Range (ATR), or volatility indicators. These extra filters can help distinguish high-probability setups from false breakouts.
  3. Dynamic Stop-Loss: Implementing dynamic or adaptive stop-loss methods, such as ATR-based or price action-based stops, can better adapt to different market conditions. This can improve risk-adjusted returns by providing more breathing room during trending phases while tightening risk during range-bound markets.
  4. Multi-Timeframe Analysis: Analyzing breakout signals across multiple timeframes can provide a more comprehensive view of the market. Traders can look for confirmations on higher timeframes, such as daily breakouts, and then execute trades on lower timeframes, such as the 4-hour chart. This helps separate short-term noise from long-term trends.

Conclusion

The Golden Harmony Breakout strategy offers a systematic approach to capturing trendline breakout trading opportunities. By combining multiple technical indicators, such as EMAs, Fibonacci levels, and moving averages, the strategy aims to generate high-probability trading signals. While the strategy has advantages in terms of multiple confirmations and trend-following, traders must still be aware of the risks of false breakouts, lagging signals, and unexpected events. By optimizing key parameters, incorporating additional indicators, employing dynamic stop-losses, and utilizing multi-timeframe analysis, the performance of the strategy can be further enhanced. Overall, the Golden Harmony Breakout strategy provides a robust framework for traders looking to capitalize on breakout trading opportunities.


/*backtest
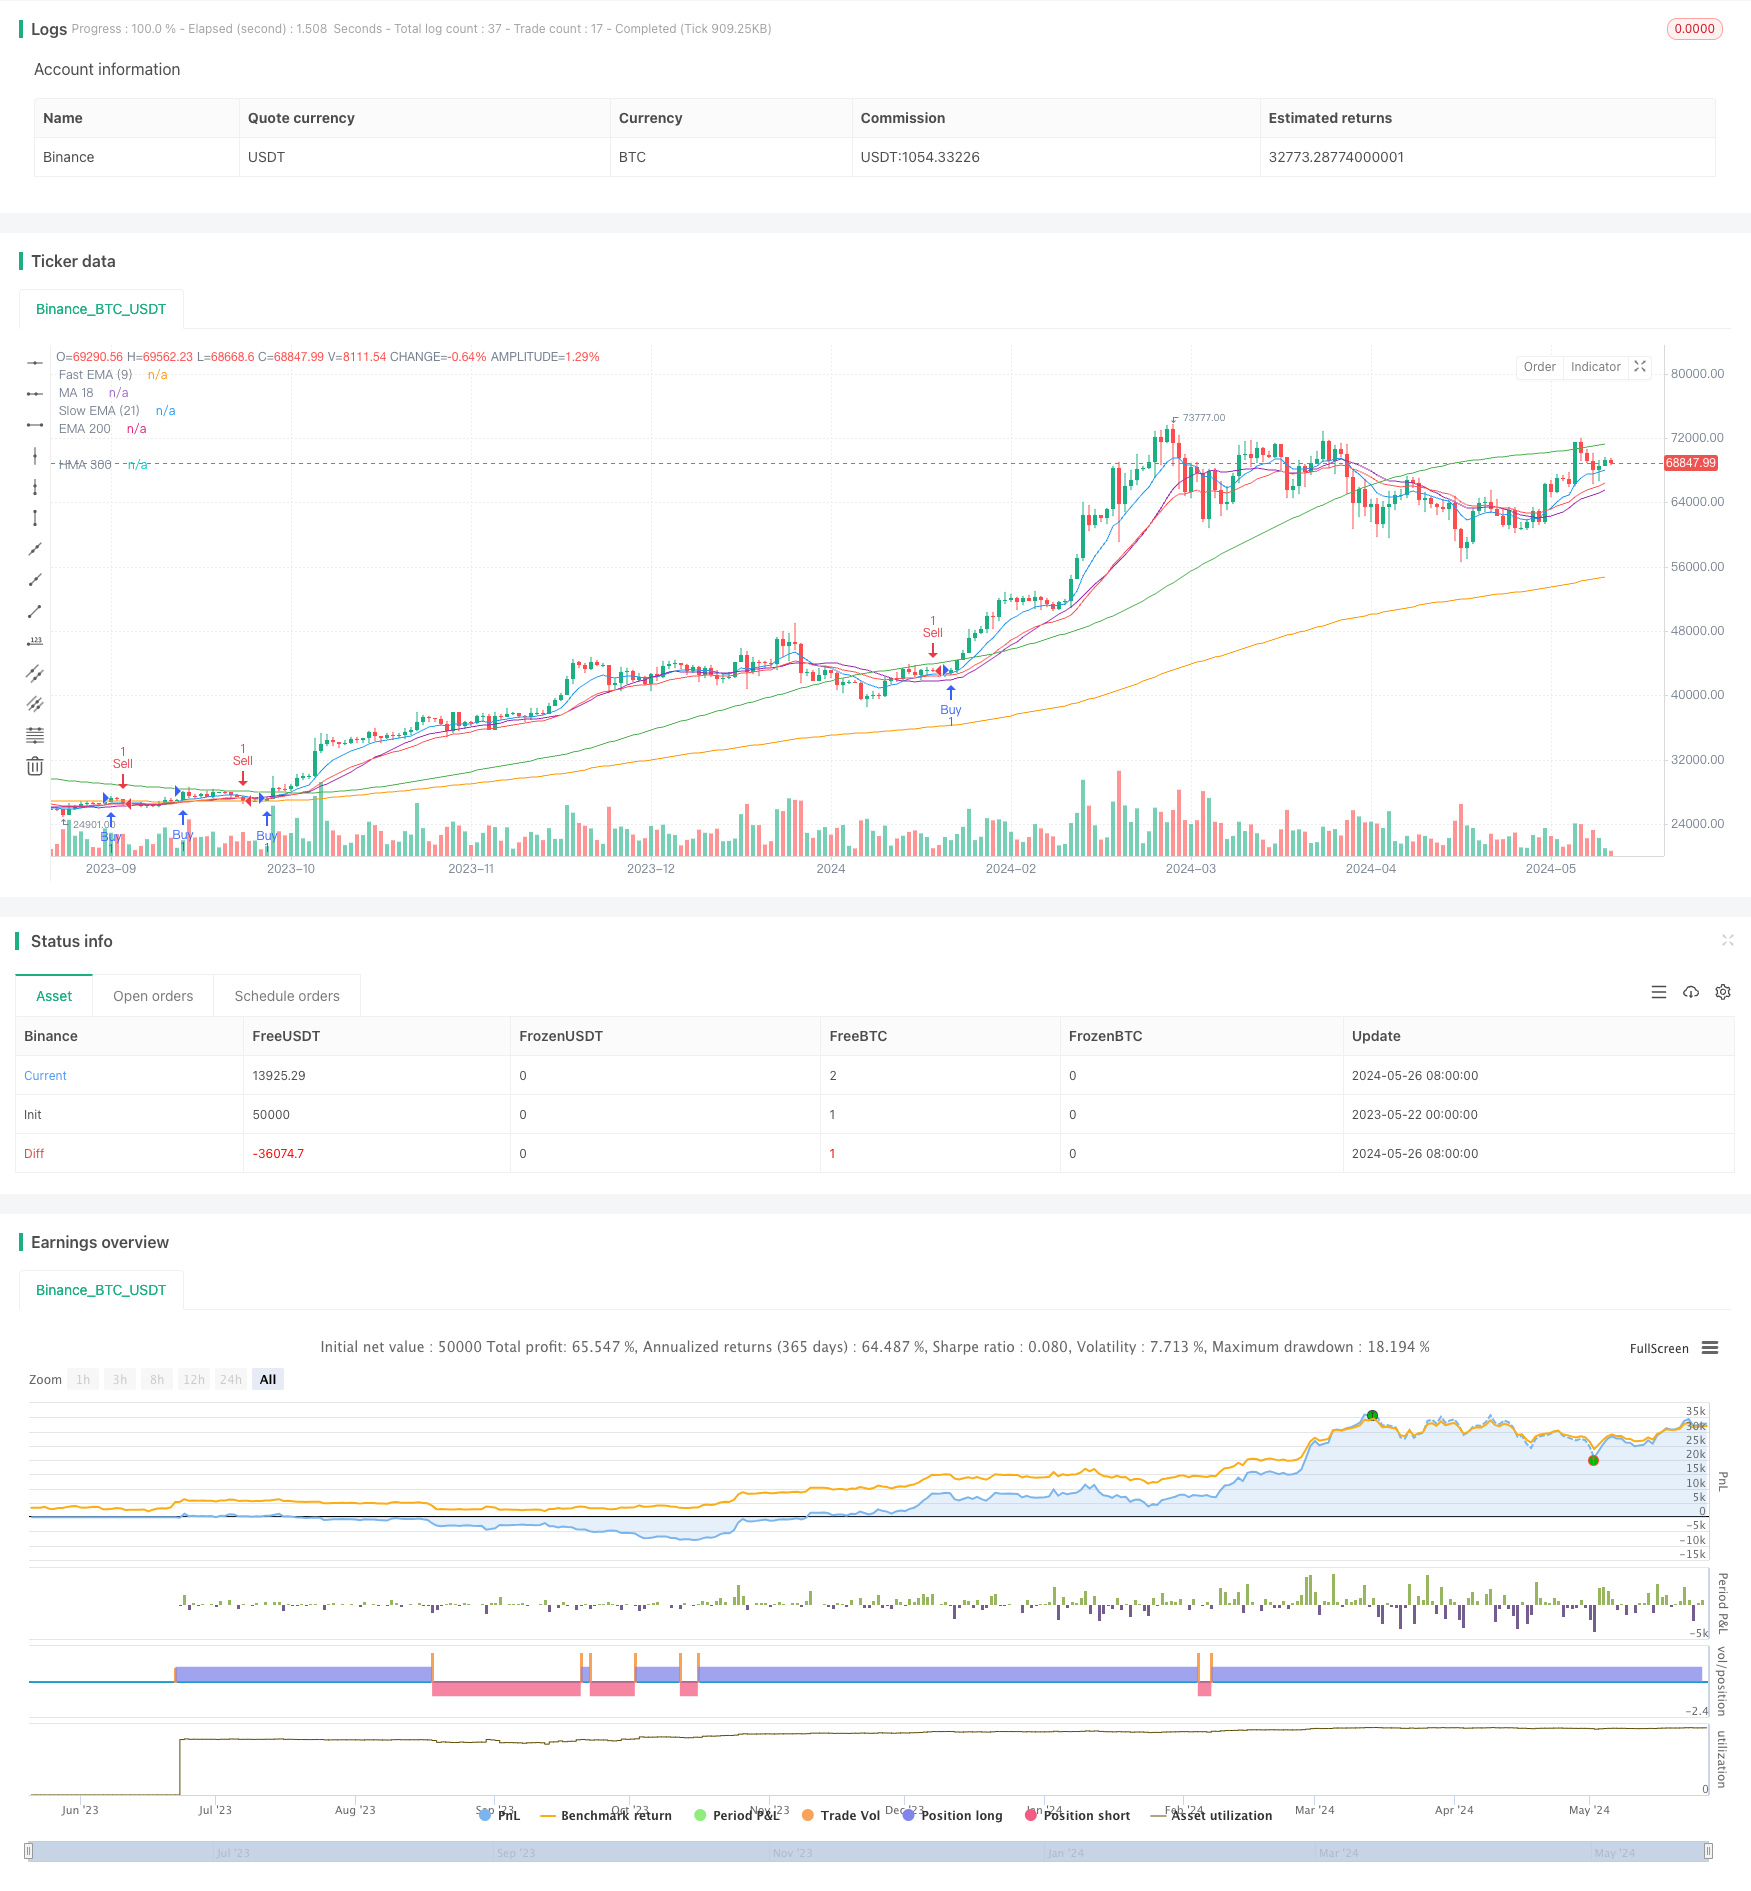
start: 2023-05-22 00:00:00
end: 2024-05-27 00:00:00
period: 1d
basePeriod: 1h
exchanges: [{"eid":"Binance","currency":"BTC_USDT"}]
*/

// This Pine Script™ code is subject to the terms of the Mozilla Public License 2.0 at https://mozilla.org/MPL/2.0/
// © spikeroy123

//@version=5
strategy("Golden Pocket Trendline Breakout Strategy", overlay=true, max_bars_back=500, max_lines_count=500)

// Core settings
int Period = input.int(10, title='Period')
bool Trendtype = input.string(title="Type", defval='Wicks', options=['Wicks', 'Body']) == 'Wicks'
string Extensions = input.string(title='Extend', defval='25', options=['25', '50', '75'])
color LineCol1 = input.color(color.rgb(109, 111, 111, 19), title="Line Color")
bool ShowTargets = input.bool(true, title="Show Targets")

// Fibonacci settings
bool ShowFib = input.bool(true, title="Show Golden Pocket")
color gp_color_618 = input.color(color.new(color.yellow, 0), title="0.618 Level Color")
color gp_color_65 = input.color(color.new(color.orange, 0), title="0.65 Level Color")

// Calculate EMAs and HMA
fast_ema = ta.ema(close, 9)
slow_ema = ta.ema(close, 21)
ema_200 = ta.ema(close, 200)
hma_300 = ta.hma(close, 300)
ma_18 = ta.sma(close, 18)

// Plot EMAs and HMA
plot(fast_ema, color=color.blue, title="Fast EMA (9)")
plot(slow_ema, color=color.red, title="Slow EMA (21)")
plot(ema_200, color=color.orange, title="EMA 200")
plot(hma_300, color=color.green, title="HMA 300")
plot(ma_18, color=color.purple, title="MA 18") // Plot 18-day moving average

// Calculate and plot Golden Pocket
var float low = na
var float high = na
var float fib_618 = na
var float fib_65 = na

if (ta.crossover(fast_ema, slow_ema))  // Example condition to reset high and low
    low := na(low) ? close : math.min(low, close)
    high := na(high) ? close : math.max(high, close)
else if (ta.crossunder(fast_ema, slow_ema))  // Example condition to plot the golden pocket
    low := na
    high := na

if (ShowFib and not na(low) and not na(high))
    fib_618 := high - (high - low) * 0.618
    fib_65 := high - (high - low) * 0.65


if (ShowFib and not na(fib_618) and close > fib_618 and ta.crossover(close, fib_618))
    strategy.entry("Buy", strategy.long)

if (ShowFib and not na(fib_618) and close < fib_618 and ta.crossunder(close, fib_618))
    strategy.entry("Sell", strategy.short)

template: strategy.tpl:40:21: executing "strategy.tpl" at <.api.GetStrategyListByName>: wrong number of args for GetStrategyListByName: want 7 got 6