ATR and EMA-based Dynamic Take Profit and Stop Loss Adaptive Strategy

Overview
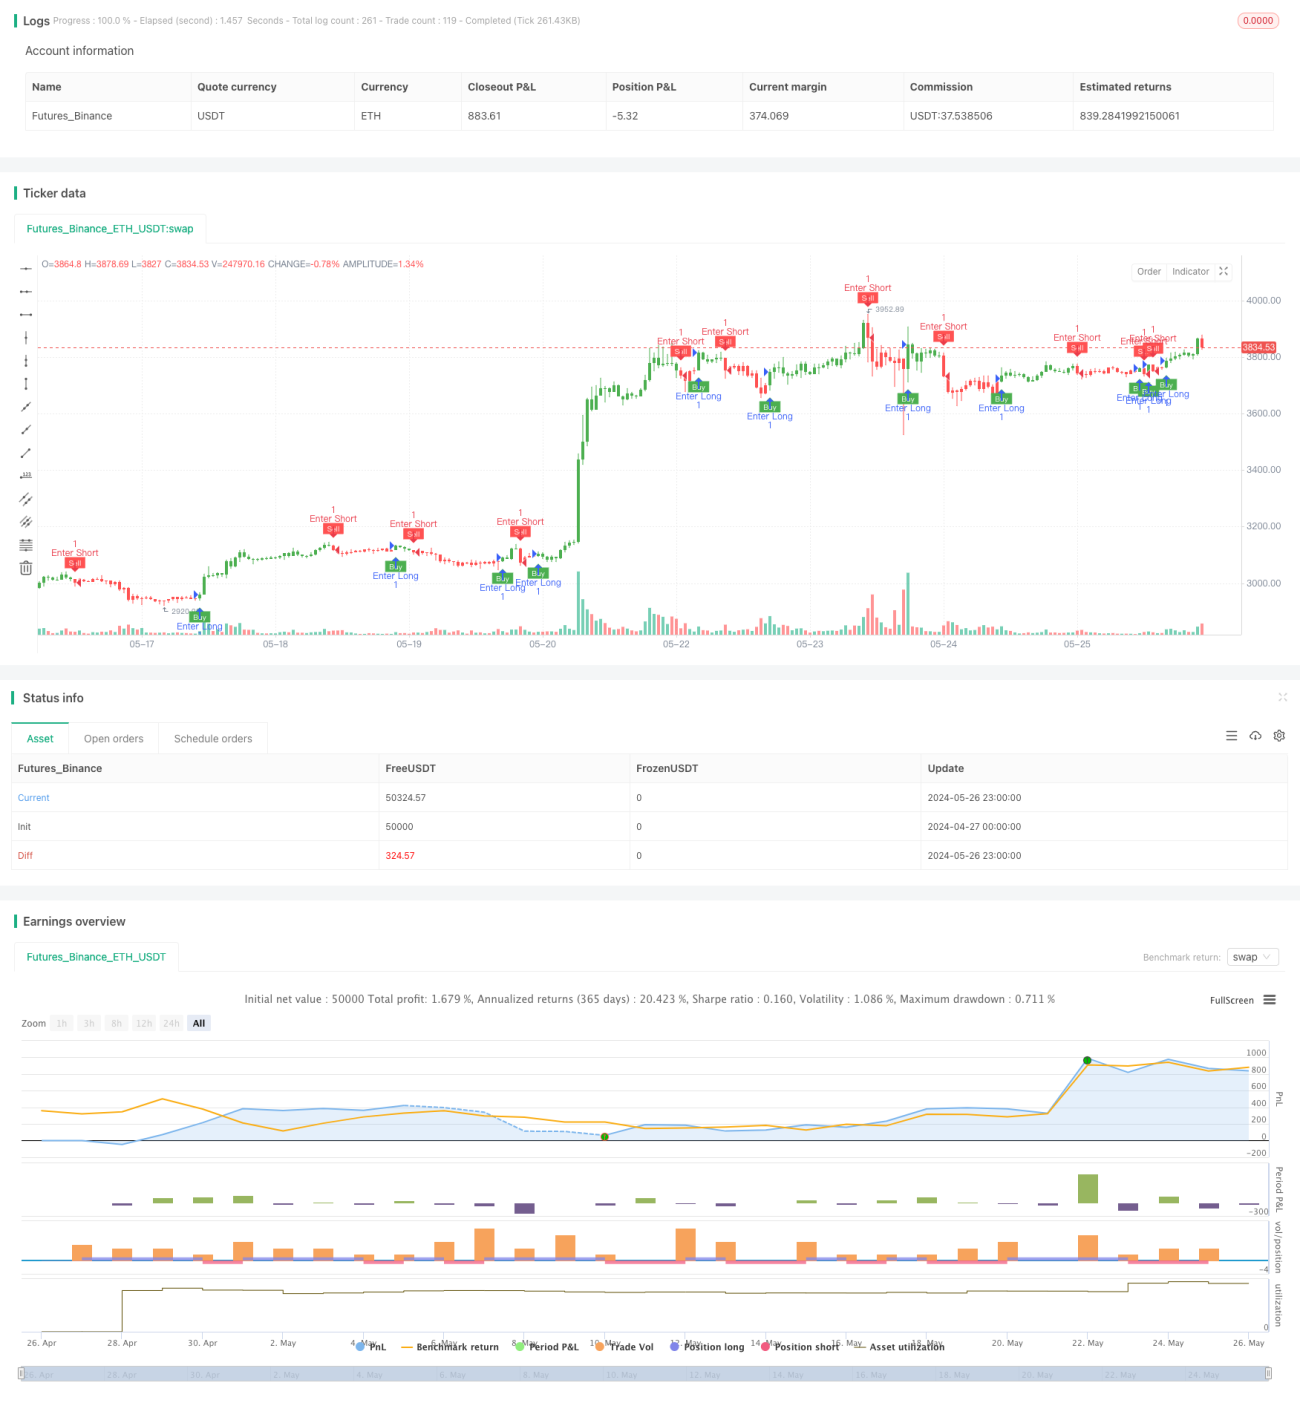
This strategy utilizes two indicators, ATR (Average True Range) and EMA (Exponential Moving Average), to dynamically adjust take profit and stop loss levels in order to adapt to market volatility. The main idea of the strategy is to use the ATR indicator to measure market volatility and set take profit and stop loss levels based on the magnitude of volatility. At the same time, the EMA indicator is used to determine the trading direction. When the price breaks above the EMA, a long position is opened, and when the price breaks below the EMA, a short position is opened. This strategy can automatically adjust take profit and stop loss levels according to changes in market volatility, thereby achieving the purpose of dynamic risk control.
Strategy Principle
- Calculate the ATR indicator to measure the magnitude of market volatility.
- Calculate the dynamic stop loss level based on the ATR value and the input multiple parameter.
- Use the EMA indicator as a filter condition. Open a long position when the price breaks above the EMA, and open a short position when the price breaks below the EMA.
- While holding a position, continuously adjust the take profit and stop loss levels based on price changes and dynamic stop loss level changes.
- When the price reaches the dynamic stop loss level, close the position and open a reverse position.
Strategy Advantages
- Strong adaptability: By dynamically adjusting take profit and stop loss levels, the strategy can adapt to changes in volatility under different market conditions and control risks.
- Strong trend-following ability: The EMA indicator is used to determine the trading direction, which can effectively capture market trends.
- Adjustable parameters: By adjusting the ATR period and multiple parameters, the risk and return of the strategy can be flexibly controlled.
Strategy Risks
- Parameter setting risk: The setting of the ATR period and multiple parameters will directly affect the performance of the strategy. Improper parameter settings may lead to strategy failure.
- Oscillating market risk: In an oscillating market, frequent opening and closing of positions may lead to large slippage and transaction fee losses.
- Trend reversal risk: When the market trend reverses, the strategy may experience consecutive losses.
Strategy Optimization Directions
- Introduce more technical indicators, such as MACD and RSI, to improve the accuracy of trend judgment.
- Optimize the calculation method of take profit and stop loss levels, such as introducing trailing stop loss and dynamic ratio stop loss methods.
- Optimize parameters to find the best combination of ATR period and multiple parameters to improve the stability and profitability of the strategy.
- Add a position management module to dynamically adjust position size based on market volatility and account risk level.
Summary
This strategy utilizes the ATR and EMA indicators to dynamically adjust take profit and stop loss levels to adapt to changes in market volatility, while using the EMA indicator to determine the trading direction. The strategy has strong adaptability and trend-following capabilities, but may face certain risks in parameter settings, oscillating markets, and trend reversals. In the future, the performance of the strategy can be improved by introducing more technical indicators, optimizing take profit and stop loss algorithms, parameter optimization, and adding position management modules.
- 1