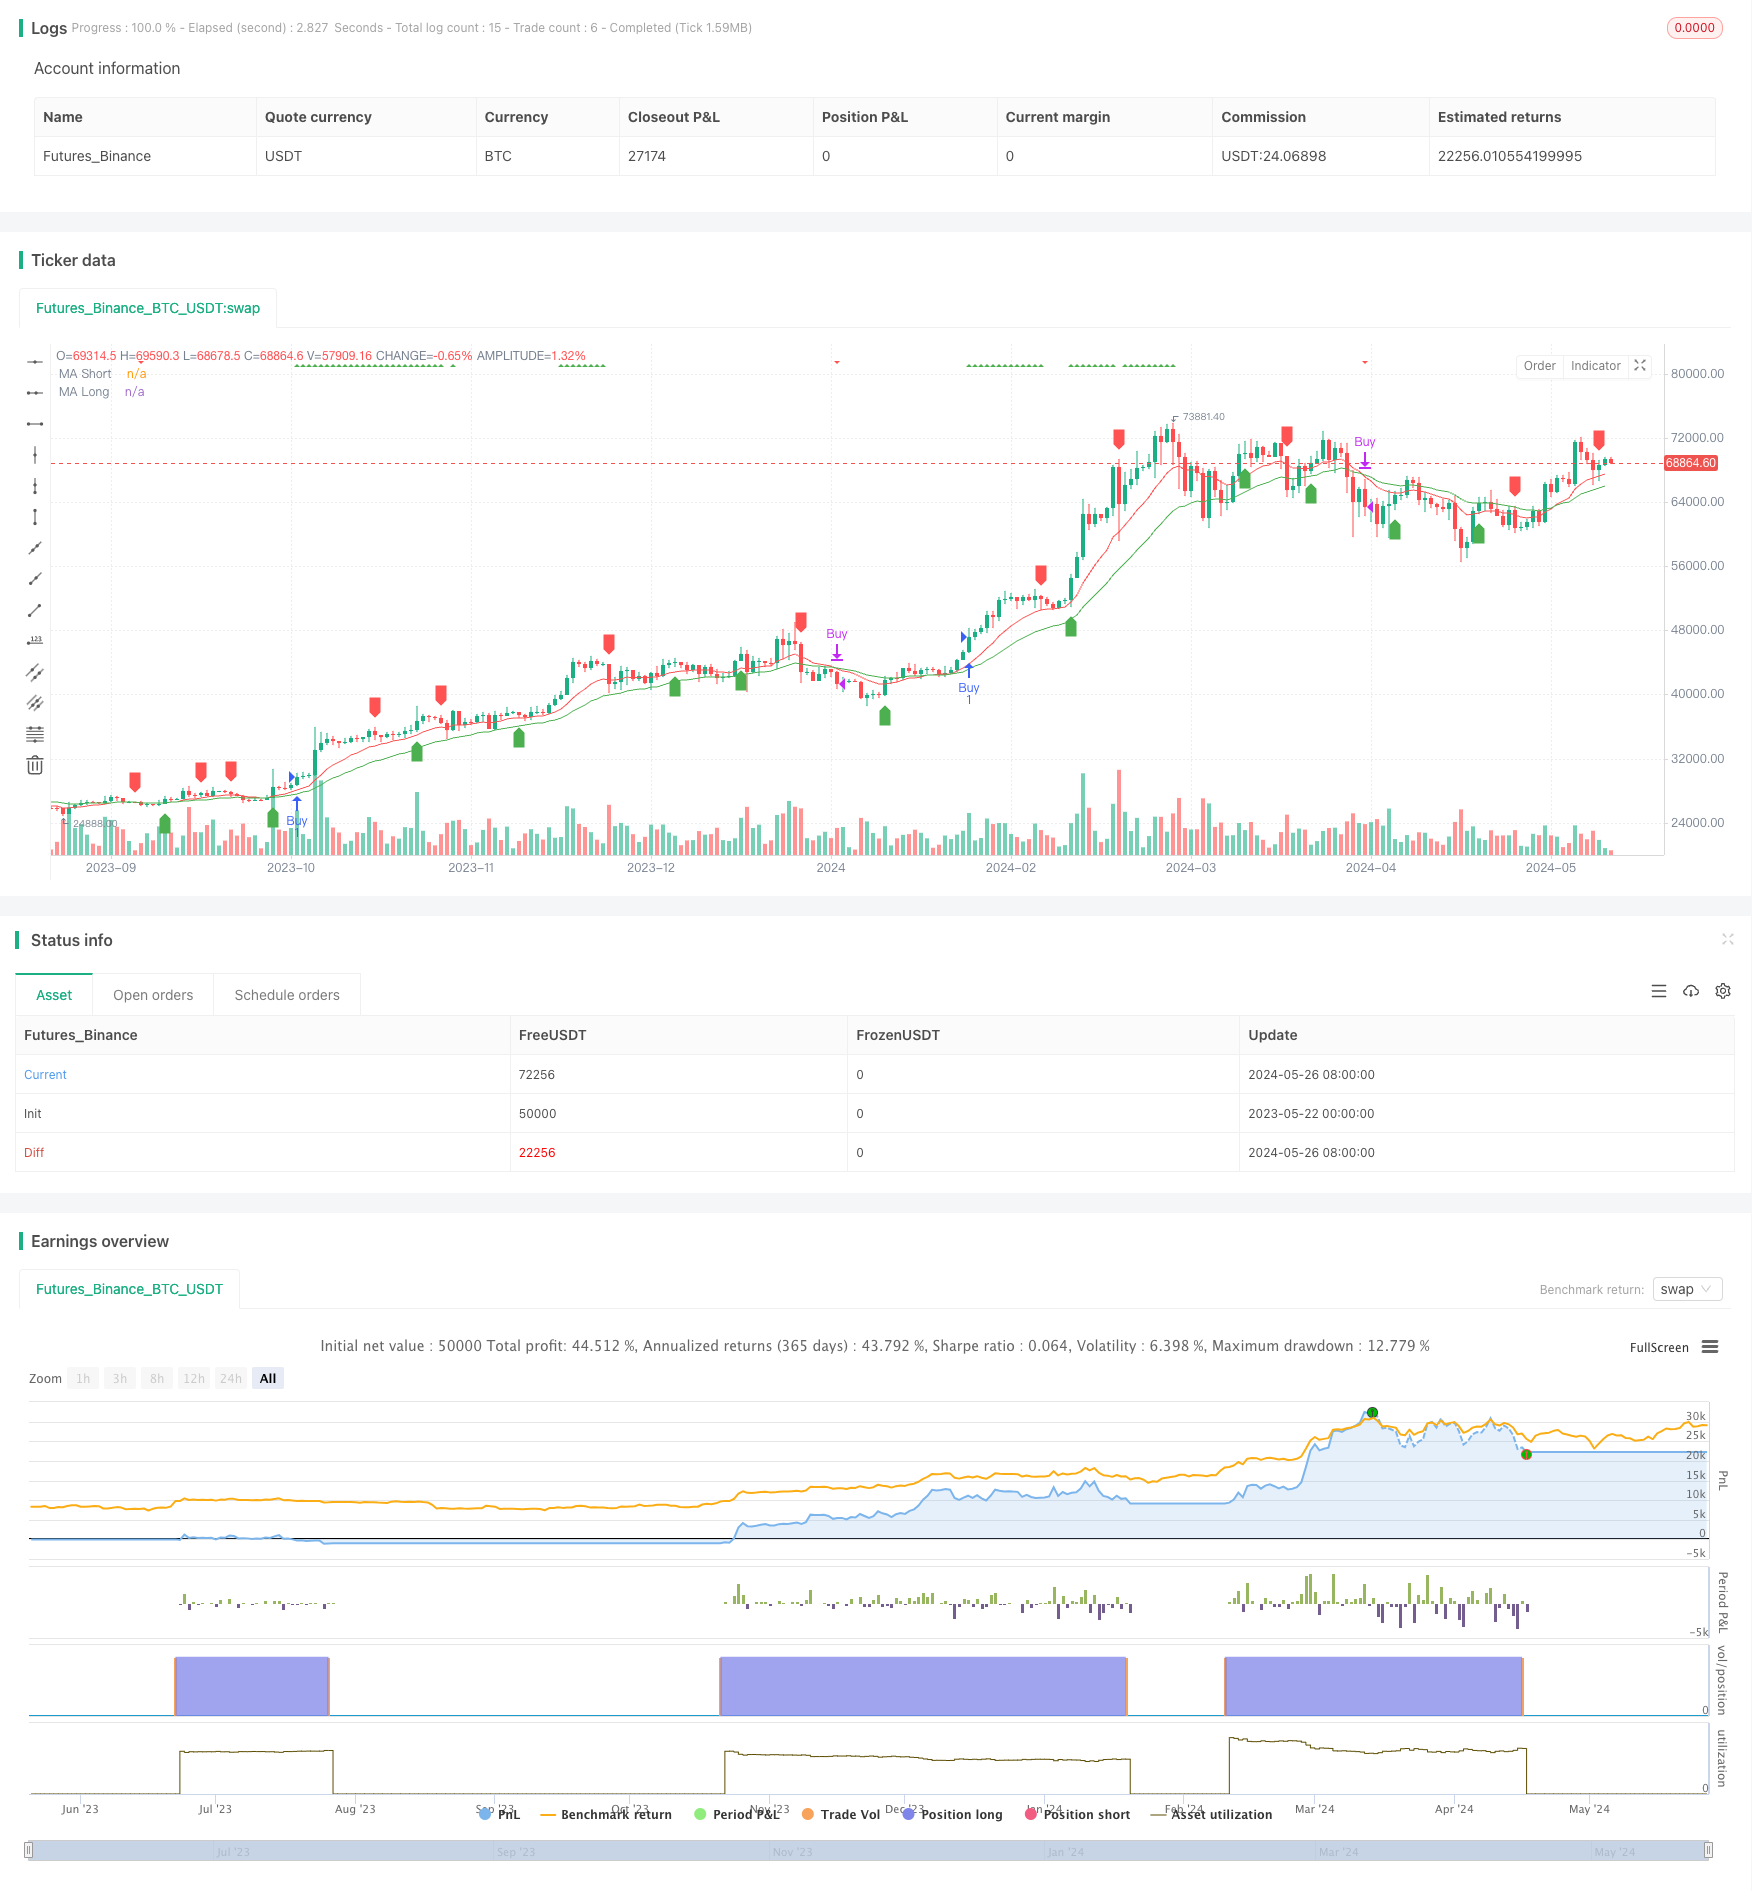
概述
该策略结合了RSI指标与移动平均线(MA)来生成交易信号。RSI用于判断市场是否超买或超卖,MA用于判断价格趋势。当RSI超买且价格高于MA时产生买入信号;当RSI超卖或MA产生死叉时产生卖出信号。此外,策略还引入了随机RSI指标(StochRSI)作为辅助判断,在StochRSI产生信号时会在图表上标记提示。
策略原理
- 计算RSI指标值,判断市场是否超买(>70)或超卖(<30)。
- 计算自定义周期的MA,包括EMA、SMA、HMA和WMA四种类型,并根据参数设置决定是否在图表上显示。
- 当RSI超买且收盘价高于MA时,产生买入信号;当RSI超卖或MA产生死叉时,产生卖出信号。
- 引入StochRSI指标作为辅助判断,StochRSI超买(>70)或超卖(<30)时会在图表上标记提示,但不产生实际交易信号。
策略优势
- 将RSI和MA两个经典指标有机结合,能够较好地捕捉趋势行情和超买超卖时机。
- MA类型和参数可自由设置,灵活性较高,可以根据不同市场特征进行调整。
- 引入StochRSI指标作为辅助判断,为交易决策提供更多参考。
- 代码逻辑清晰,可读性强,便于理解和二次开发。
策略风险
- RSI和MA都是滞后指标,在趋势反转初期可能会产生较多误导信号。
- 参数设置不当可能导致信号过早或过晚,影响整体收益。
- 缺乏止损和仓位管理,在行情剧烈波动时可能承担较大风险。
策略优化方向
- 引入更多先行指标如波动率,以提前判断趋势转变。
- 对买卖信号进行过滤,如要求RSI和MA同时满足一定条件才产生信号,以提高信号准确性。
- 在策略中加入止损和仓位管理模块,控制单笔交易风险和总体风险。
- 对策略进行参数优化,寻找最佳参数组合。
- 考虑加入不同周期或多个品种,充分利用各品种或周期之间的联动关系。
总结
该策略通过结合RSI和MA两个经典指标,能够捕捉到趋势行情和超买超卖时机,同时引入StochRSI指标作为辅助判断,整体思路简单清晰。但策略也存在一些不足,如缺乏风险控制措施,信号准确性有待提高等。未来可从引入更多指标、优化信号规则、加入风控模块等方面对策略进行完善,以期获得更加稳健的收益。
策略源码
/*backtest
start: 2023-05-22 00:00:00
end: 2024-05-27 00:00:00
period: 1d
basePeriod: 1h
exchanges: [{"eid":"Futures_Binance","currency":"BTC_USDT"}]
*/

//@version=5
strategy("RSI Strategy with Customizable MA and StochRSI Alert", overlay=true)

// กำหนดค่า RSI สำหรับการเปิดสัญญาณซื้อและขาย
rsiOverbought = input(70, title="RSI Overbought Level")
rsiOversold = input(30, title="RSI Oversold Level")

// เลือกชนิดของเส้นค่าเฉลี่ยเคลื่อนที่
maType = input.string("EMA", title="MA Type", options=["EMA", "SMA", "HMA", "WMA"])

// กำหนดค่าเส้นค่าเฉลี่ยเคลื่อนที่
maShortLength = input(12, title="MA Short Length")
maLongLength = input(26, title="MA Long Length")

// เลือกการแสดงผลของเส้นค่าเฉลี่ยเคลื่อนที่
showShortMA = input(true, title="Show Short Moving Average")
showLongMA = input(true, title="Show Long Moving Average")

// ฟังก์ชันสำหรับเลือกชนิดของเส้นค่าเฉลี่ยเคลื่อนที่
f_ma(src, length, type) =>
    switch type
        "SMA" => ta.sma(src, length)
        "EMA" => ta.ema(src, length)
        "HMA" => ta.hma(src, length)
        "WMA" => ta.wma(src, length)

// คำนวณค่าเส้นค่าเฉลี่ยเคลื่อนที่
maShort = showShortMA ? f_ma(close, maShortLength, maType) : na
maLong = showLongMA ? f_ma(close, maLongLength, maType) : na

// คำนวณค่า RSI
rsiValue = ta.rsi(close, 14)

// สร้างสัญญาณซื้อและขาย
buySignal = (rsiValue > rsiOverbought and ((showShortMA and showLongMA and close > maShort and maShort > maLong) or (showShortMA and not showLongMA and close > maShort) or (showLongMA and not showShortMA and close > maLong)))
sellSignal = (showShortMA and showLongMA and ta.crossover(maLong, maShort)) or (showShortMA and not showLongMA and ta.crossover(maShort, close)) or (showLongMA and not showShortMA and ta.crossover(maLong, close))

// แสดงค่าเส้นค่าเฉลี่ยเคลื่อนที่บนกราฟ
plot(maShort, color=color.red, title="MA Short")
plot(maLong, color=color.green, title="MA Long")

// คำนวณค่า Stochastic RSI
smoothK = 3
smoothD = 3
RSIlen = 14
STOlen = 14
SRsrc = close
OSlevel = 30
OBlevel = 70

rsi1 = ta.rsi(SRsrc, RSIlen)
k = ta.sma(ta.stoch(rsi1, rsi1, rsi1, STOlen), smoothK)
d = ta.sma(k, smoothD)

stochRSIOverbought = OBlevel
stochRSIOversold = OSlevel

stochRSIBuyAlert = ta.crossover(k, stochRSIOversold)
stochRSISellAlert = ta.crossunder(k, stochRSIOverbought)

// สร้างคำสั่งซื้อและขายเมื่อมีสัญญาณจาก RSI และ MA เท่านั้น
if (buySignal)
    strategy.entry("Buy", strategy.long)
if (sellSignal)
    strategy.close("Buy")

// แสดงสัญญาณเตือนจาก Stochastic RSI บนกราฟ
plotshape(series=stochRSIBuyAlert, location=location.belowbar, color=color.green, style=shape.labelup, title="StochRSI Buy Alert")
plotshape(series=stochRSISellAlert, location=location.abovebar, color=color.red, style=shape.labeldown, title="StochRSI Sell Alert")

// แสดงสัญญาณซื้อและขายจาก RSI และ MA บนกราฟ
plotshape(series=buySignal, location=location.top, color=color.green, style=shape.triangleup, title="RSI>70")
plotshape(series=sellSignal, location=location.top, color=color.red, style=shape.triangledown, title="MA crossoverDown")
相关推荐