Volatility and Linear Regression-based Long-Short Market Regime Optimization Strategy

Overview
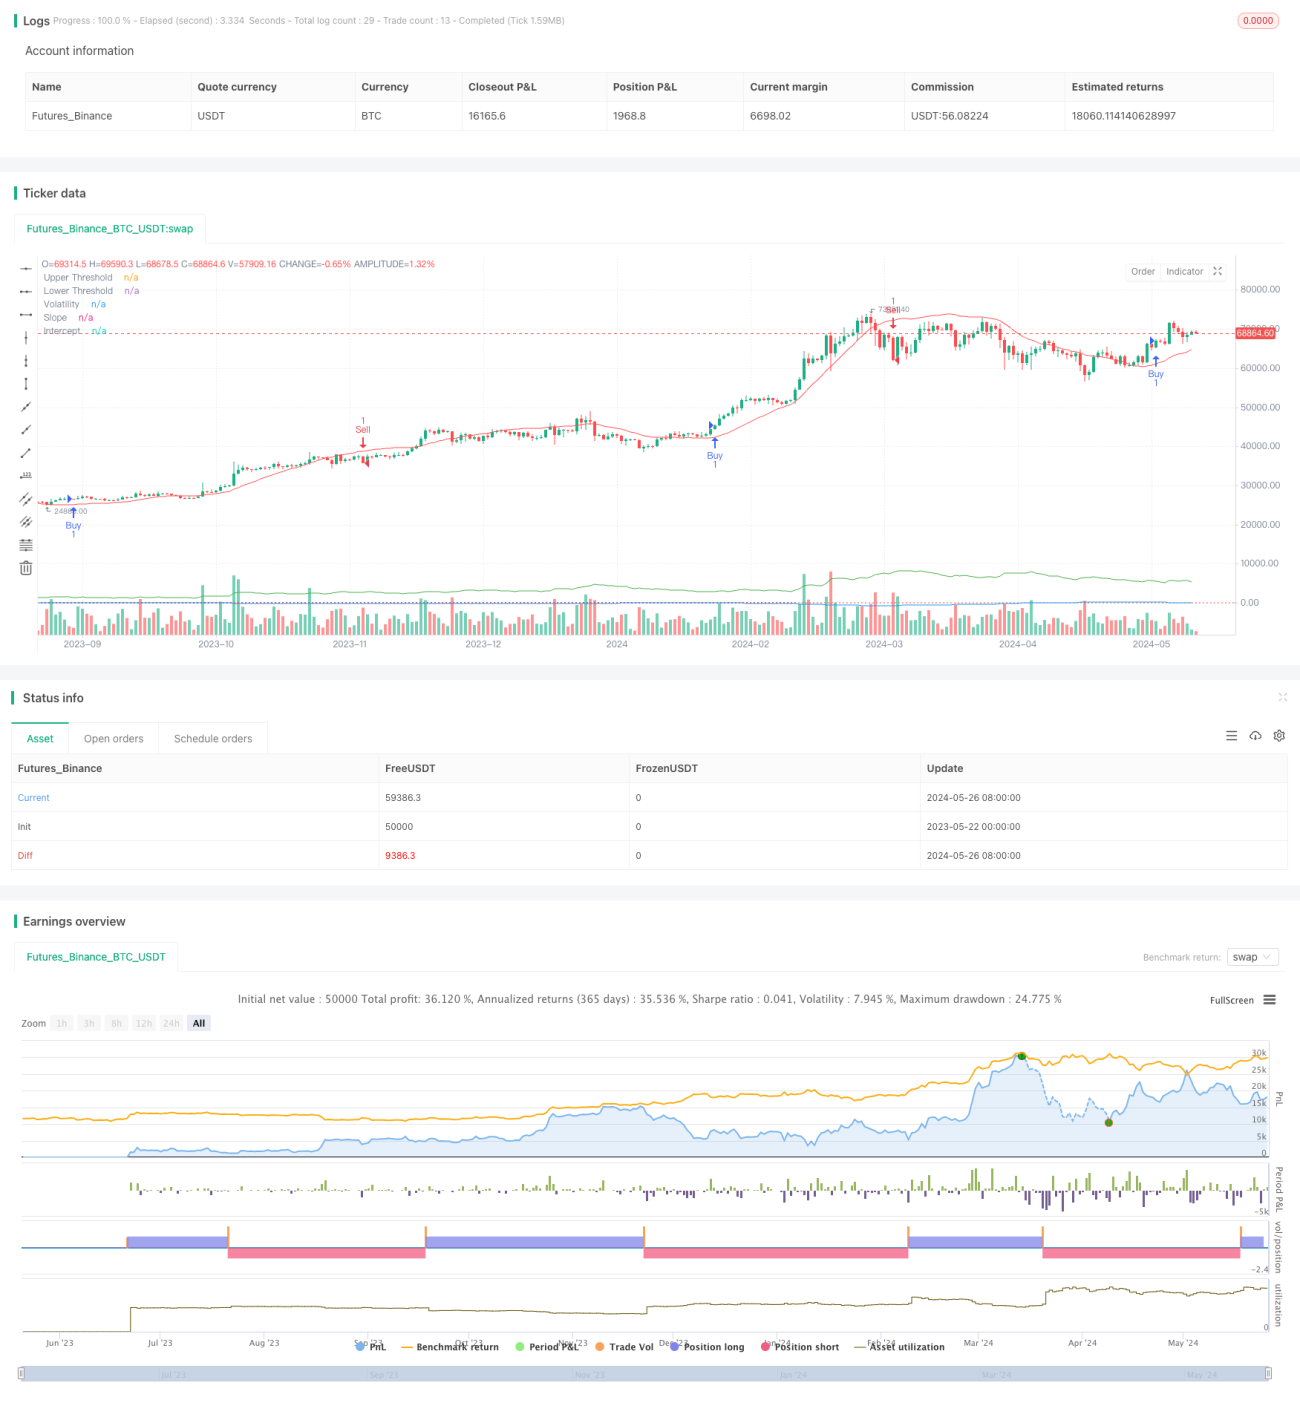
The strategy utilizes linear regression and volatility indicators to identify different market states. When the conditions for buying or selling are met, the strategy establishes corresponding long or short positions. Additionally, the strategy allows for parameter optimization and adjustment based on market conditions to adapt to various market environments. The strategy also employs exponential moving averages (EMAs) as additional indicators to confirm trading signals.
Strategy Principles
- Calculate the intercept and slope of the linear regression to determine market trends.
- Calculate the Average True Range (ATR) multiplied by a multiplier as the volatility indicator.
- Generate a buy signal when the slope is greater than the upper threshold and the price is above the regression line plus volatility.
- Generate a sell signal when the slope is less than the lower threshold and the price is below the regression line minus volatility.
- Use fast and slow EMAs as additional confirmation indicators.
- Establish a long position when a buy signal occurs and the fast EMA is above the slow EMA.
- Establish a short position when a sell signal occurs and the fast EMA is below the slow EMA.
Strategy Advantages
- By combining linear regression and volatility indicators, the strategy can more accurately identify market states and trends.
- The use of additional EMA indicators to confirm trading signals enhances the reliability of the strategy.
- Allowing optimization of key parameters enables adaptation to different market environments and instrument characteristics.
- Considering both trends and volatility, the strategy can promptly establish positions when trends are clear and control risks when volatility increases.
Strategy Risks
- Improper parameter selection may lead to poor strategy performance, requiring optimization based on specific instruments and market characteristics.
- In choppy markets or at trend turning points, the strategy may experience frequent trades or false signals.
- The strategy relies on historical data and may not react promptly to sudden events or abnormal market fluctuations.
Strategy Optimization Directions
- Incorporate other technical indicators or fundamental factors to enrich the decision-making basis and improve signal accuracy.
- Optimize parameter selection, such as regression length, volatility multiplier, EMA periods, etc., to adapt to different instruments and market characteristics.
- Introduce stop-loss and take-profit mechanisms to control individual trade risks and overall drawdown levels.
- Consider incorporating position sizing and money management rules to adjust position sizes based on market volatility and account equity.
Summary
The strategy identifies market states using linear regression and volatility indicators, with EMAs as confirmation indicators, constructing an adaptive and logically clear trading strategy. The strategy's advantages lie in combining trends and volatility while allowing parameter optimization, making it suitable for various market environments. However, the strategy also faces risks such as parameter selection, choppy markets, and black swan events, requiring continuous optimization and improvement in practical applications. Future enhancements can focus on enriching signal sources, optimizing parameter selection, and refining risk control measures to enhance the strategy's stability and profitability.
- 1