Bollinger Bands Accurate Entry And Risk Control Strategy

Overview
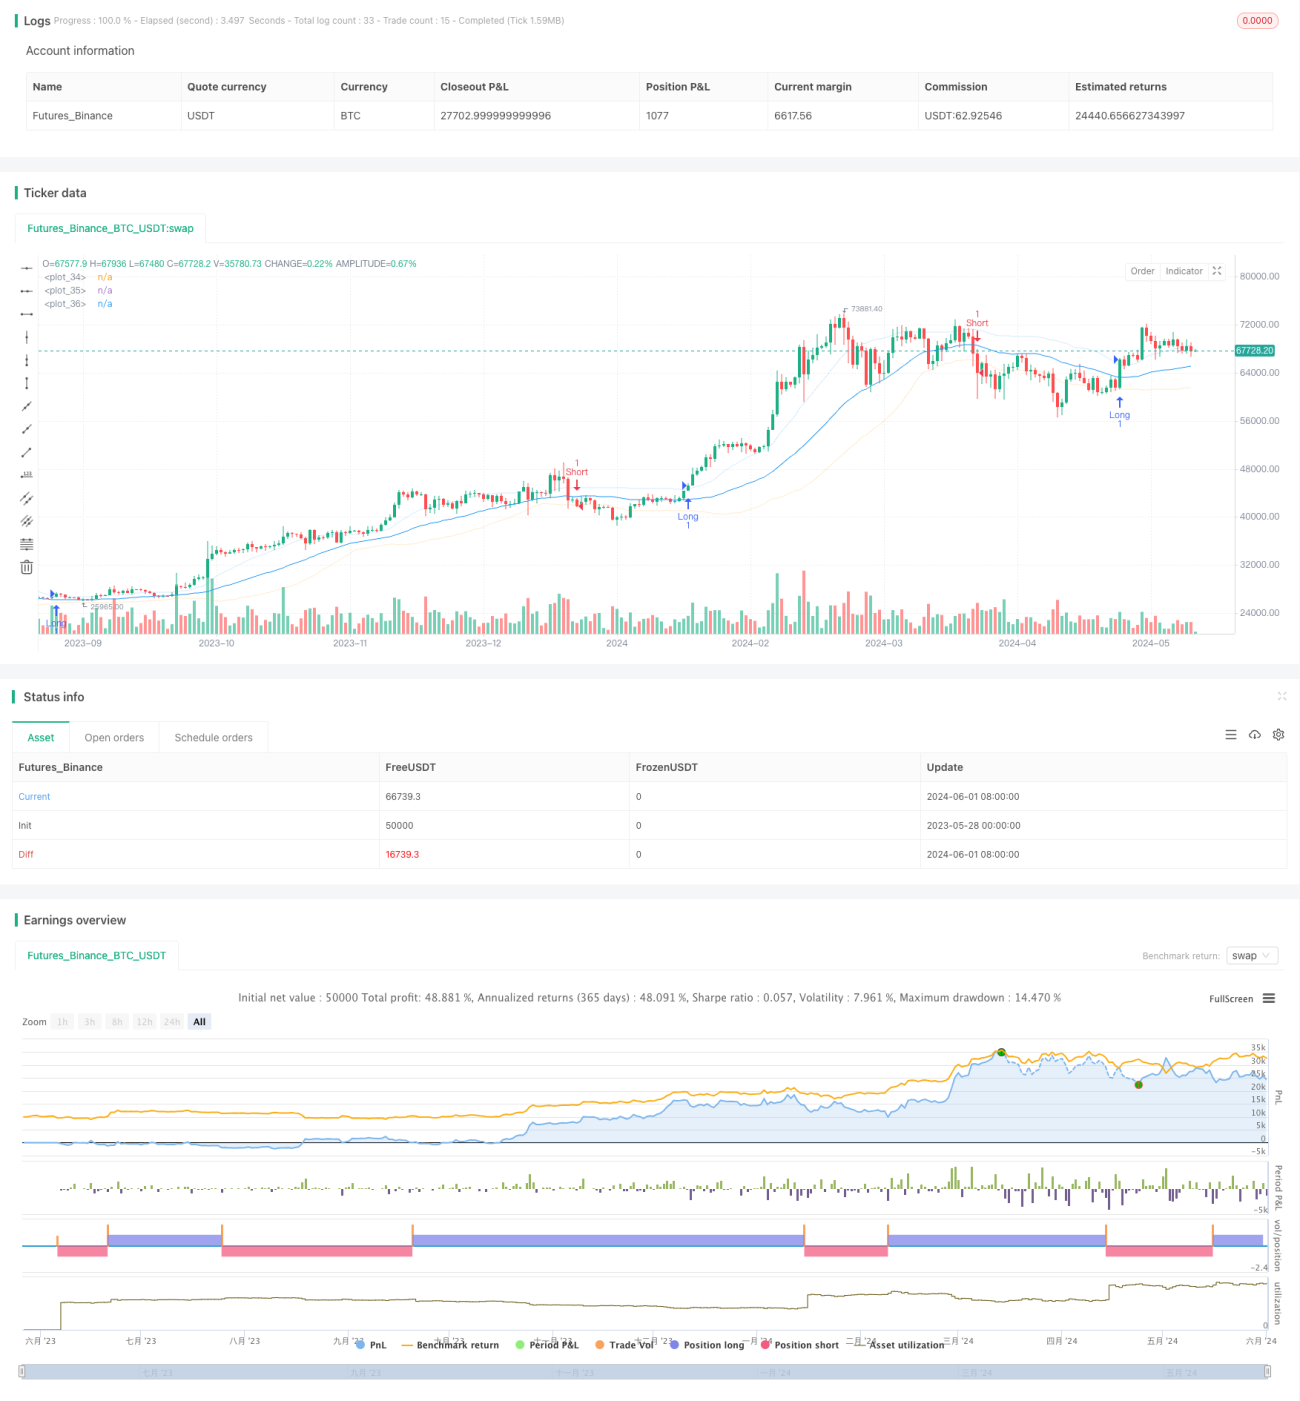
This strategy uses Bollinger Bands as the main indicator. By analyzing the relationship between price and the upper and lower bands, it enters trades under specific conditions. The main idea of the strategy is: when the closing price breaks above the upper band, it goes long; when it breaks below the lower band, it goes short. At the same time, it uses opposite signals to close positions, thereby capturing price fluctuations.
Strategy Principle
- Calculate the middle, upper, and lower bands of the Bollinger Bands. The middle band is the simple moving average of the closing price, and the upper and lower bands are the middle band plus or minus a certain multiple of standard deviations.
- When the closing price breaks above the upper band, it triggers the long condition and opens a long position.
- When the closing price breaks below the lower band, it triggers the short condition and opens a short position.
- When holding a long position, if the short condition appears, the long position is closed.
- When holding a short position, if the long condition appears, the short position is closed.
Strategy Advantages
- Bollinger Bands can effectively reflect price fluctuations, and using them as trading signals has a certain degree of reliability.
- The strategy logic is clear and easy to understand and implement.
- In trending markets, this strategy can capture price fluctuations well and obtain good returns.
- The strategy does not use too many indicators, reducing noise interference and improving the effectiveness of signals.
Strategy Risks
- In range-bound markets, this strategy may experience frequent trading, leading to high transaction costs.
- The selection of Bollinger Band parameters has a significant impact on strategy performance, and inappropriate parameters may cause the strategy to fail.
- The strategy does not set a stop loss, which may face greater risks when the market reverses sharply.
- The strategy does not consider the characteristics of different trading instruments, and parameters may need to be adjusted for different instruments.
Strategy Optimization Directions
- Introduce other indicators, such as trend or oscillator indicators, to confirm Bollinger Band signals and improve trading accuracy.
- Optimize parameters, such as the period and standard deviation multiple of Bollinger Bands, to adapt to different market conditions.
- Set reasonable stop losses and take profits to control single transaction risk.
- Adjust the strategy according to the characteristics of trading instruments, such as volatility and liquidity.
- Consider introducing position management to dynamically adjust positions according to market conditions and improve the risk-return ratio.
Summary
This strategy uses Bollinger Bands as the core and conducts trades under specific conditions by analyzing the relationship between price and Bollinger Bands. The strategy logic is clear and easy to understand and implement. It can obtain good returns in trending markets. However, it also has some risks, such as frequent trading and improper parameter selection. By introducing other indicators, optimizing parameters, setting stop losses and take profits, and other methods, the performance of the strategy can be further improved to better adapt to different market environments.
- 1