
Overview
The Moving Average Convergence Momentum Cloud Strategy is a comprehensive trading approach designed to provide robust signals for both trending and ranging market conditions by combining multiple technical indicators. The strategy integrates moving averages, Bollinger Bands, the Relative Strength Index (RSI), and the Ichimoku Cloud to offer a holistic view of market dynamics, enabling traders to make informed decisions.
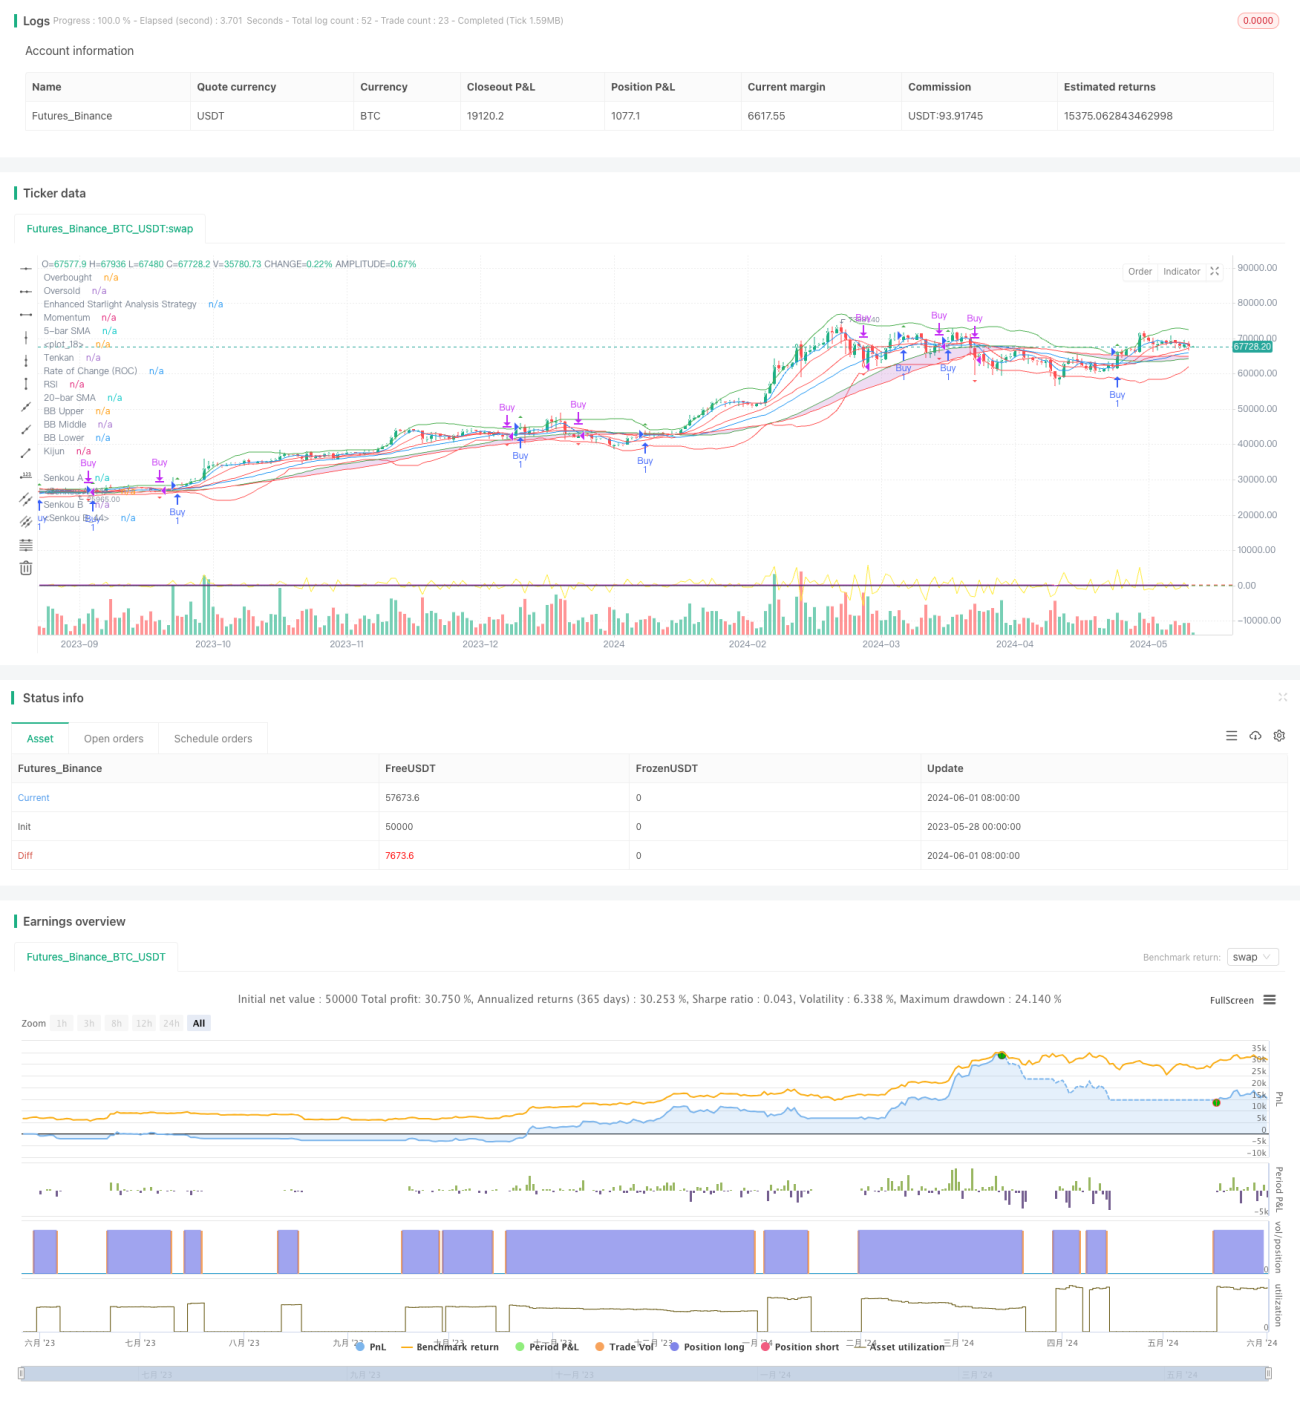
The strategy employs a short-term moving average (5-period SMA) and a long-term moving average (20-period SMA) to identify price trends. A buy signal is generated when the short-term moving average crosses above the long-term moving average, while a sell signal is triggered when it crosses below. Bollinger Bands are utilized to measure market volatility and identify potential overbought and oversold conditions. The RSI indicator is used to gauge market momentum and potential reversal points. The Ichimoku Cloud provides insights into support and resistance levels, trend direction, and potential future price action. Additionally, the strategy calculates momentum and rate of change (ROC) indicators to further analyze the strength of market trends.
Strategy Logic
The core principle of the Moving Average Convergence Momentum Cloud Strategy is to combine multiple technical indicators for a comprehensive assessment of market conditions. By analyzing the relationship between price and moving averages, the strategy determines the current trend direction. A crossover of the short-term moving average above or below the long-term moving average is considered a signal of a potential trend reversal. Bollinger Bands provide insights into market volatility by measuring the deviation of price from its statistical mean. The RSI indicator reveals the momentum condition of the market, helping to identify potential overbought and oversold levels. The Ichimoku Cloud, which combines multiple moving averages, forms a cloud area that offers insights into support, resistance, and future price action. Momentum and ROC indicators further quantify the speed and magnitude of price changes. By holistically considering all these indicators, the strategy aims to generate reliable and timely trading signals.
Strategy Advantages
The main advantage of the Moving Average Convergence Momentum Cloud Strategy lies in its multidimensional approach to market analysis. By combining moving averages, Bollinger Bands, RSI, and the Ichimoku Cloud, the strategy provides a comprehensive assessment of market conditions, resulting in more reliable trading signals. The moving average crossover effectively identifies shifts in trends, while Bollinger Bands and RSI help determine potential entry and exit points. The Ichimoku Cloud offers a visual perspective, illustrating the relationship between price and key support and resistance levels. Furthermore, momentum and ROC indicators quantify the speed and magnitude of price changes, aiding traders in evaluating the sustainability of trends. Overall, by leveraging these multiple indicators, the Moving Average Convergence Momentum Cloud Strategy is adaptable to various market conditions, providing traders with comprehensive and in-depth market insights.
Strategy Risks
Despite its numerous advantages, the Moving Average Convergence Momentum Cloud Strategy also carries certain potential risks. Firstly, the strategy relies on multiple technical indicators, which may lead to conflicting signals or false indications, particularly during periods of uncertain trends or heightened market volatility. Secondly, the strategy primarily relies on historical data and may not fully account for sudden events or fundamental changes that can impact the market. Moreover, over-optimization of parameter settings may result in the strategy's underperformance in future market conditions. To mitigate these risks, traders should exercise caution when selecting parameters and regularly evaluate and adjust the strategy. Additionally, combining the strategy with other analysis methods, such as fundamental analysis and risk management techniques, can enhance its reliability and robustness.
Strategy Optimization
The Moving Average Convergence Momentum Cloud Strategy can be optimized in several aspects to improve its performance and adaptability. Firstly, the parameters of individual indicators can be fine-tuned, such as adjusting the periods of moving averages, the standard deviation multiplier for Bollinger Bands, or the overbought/oversold thresholds for RSI. By backtesting the strategy across different market conditions and asset classes, optimal parameter combinations can be identified. Secondly, additional technical indicators or market sentiment indicators can be incorporated to enhance the strategy's signal generation capabilities. For example, including volume indicators or market volatility measures can provide additional insights. Furthermore, applying machine learning algorithms or adaptive logic can help the strategy dynamically adjust parameters to adapt to changing market environments. Lastly, integrating the strategy with risk management techniques, such as setting appropriate stop-loss and take-profit levels, can help limit potential losses and protect profits.
Conclusion
The Moving Average Convergence Momentum Cloud Strategy is a powerful and comprehensive trading approach that combines multiple technical indicators to assess market trends, momentum, and volatility. By analyzing moving average crossovers, Bollinger Bands, RSI, and the Ichimoku Cloud, the strategy generates reliable trading signals and adapts to various market conditions. While the strategy has its strengths, traders should also be aware of potential risks, such as signal conflicts and the possibility of over-optimization. To enhance the strategy's performance, traders can explore parameter optimization, incorporation of additional indicators, application of adaptive logic, and integration with risk management techniques. Overall, the Moving Average Convergence Momentum Cloud Strategy provides traders with a robust tool to make informed trading decisions by comprehensively analyzing multiple technical indicators.
- 1