RSI and Linear Regression Channel Trading Strategy

Overview
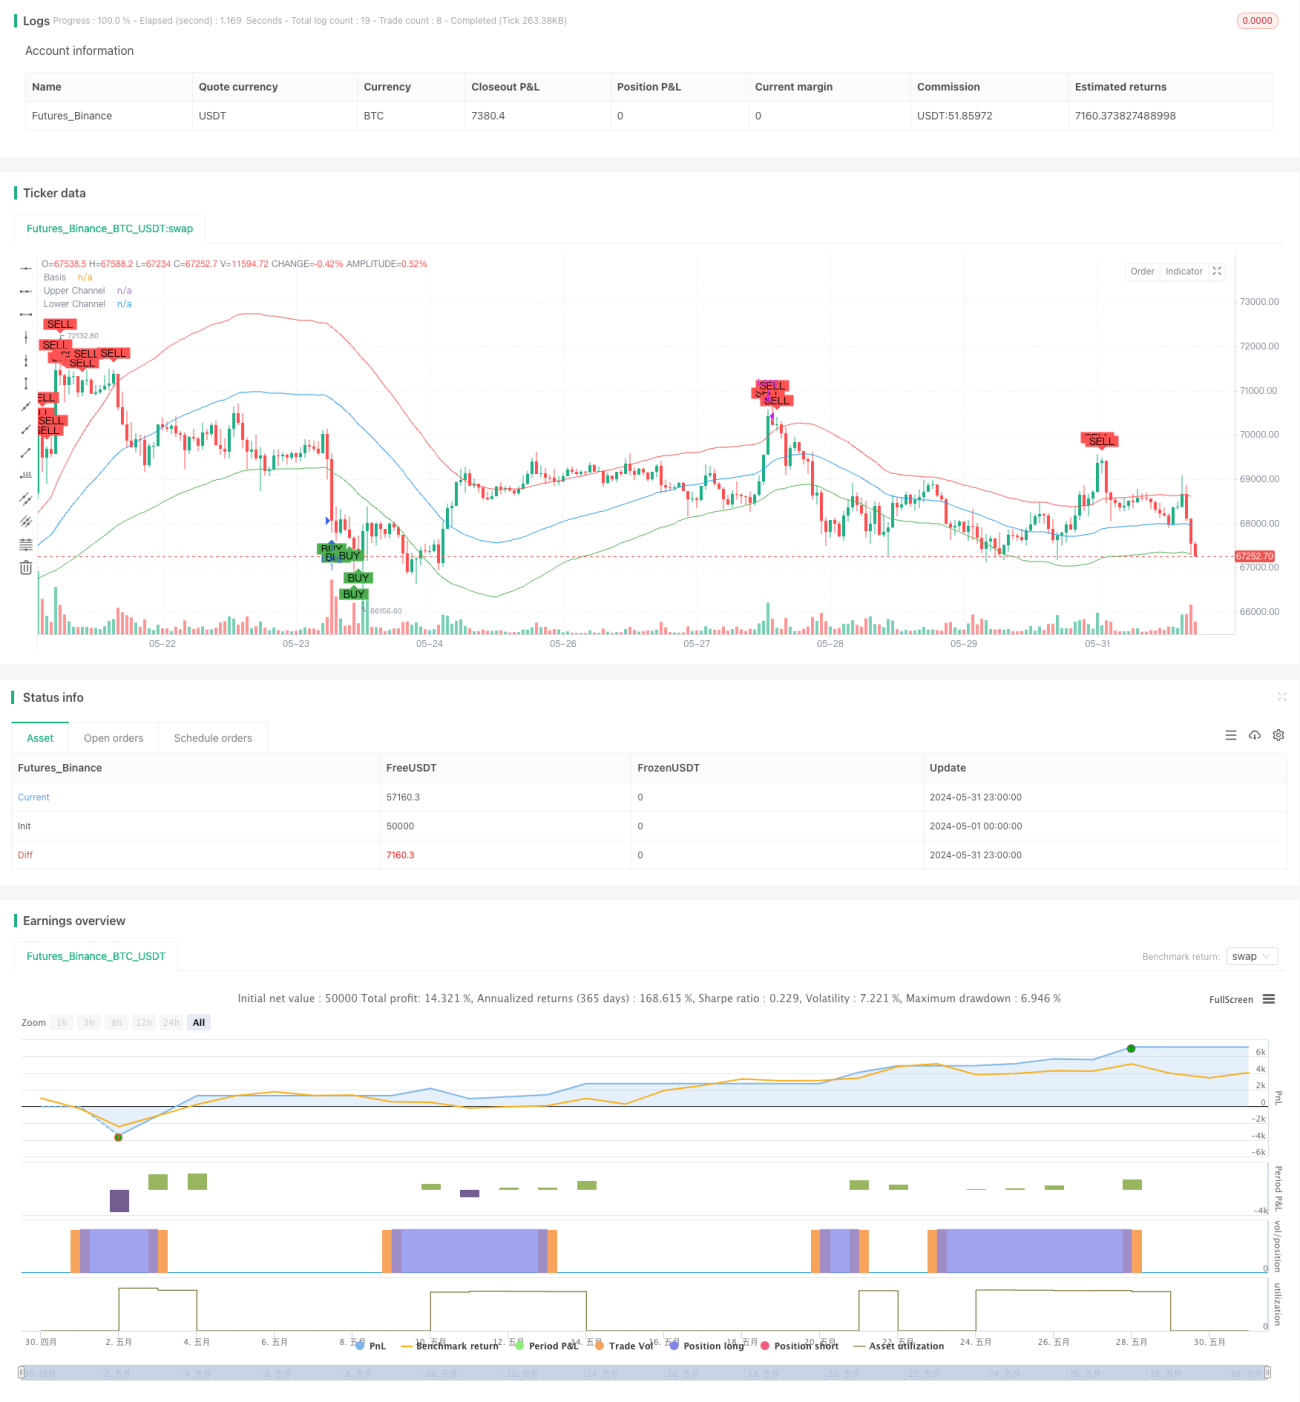
This strategy combines the Relative Strength Index (RSI) and Linear Regression Channel (LRC) technical indicators to capture overbought and oversold opportunities in the market. When the price touches the lower band of the linear regression channel and the RSI indicator is below 30, the strategy generates a buy signal. When the price touches the upper band of the linear regression channel and the RSI indicator is above 70, the strategy generates a sell signal. This approach of combining RSI and LRC can effectively identify potential trading opportunities while reducing the likelihood of false signals.
Strategy Principle
The core of this strategy is the RSI indicator and the linear regression channel. RSI is a momentum indicator used to measure the magnitude and direction of recent price changes. When RSI is below 30, the market is considered oversold, and when RSI is above 70, the market is considered overbought. The linear regression channel is a trend-following indicator consisting of a baseline and two parallel lines (upper and lower channels). The baseline is the linear regression of the closing prices, while the upper and lower channel lines are the baseline plus or minus a certain standard deviation. When the price touches the lower channel line, the market may be oversold and could potentially bounce back. When the price touches the upper channel line, the market may be overbought and could potentially pull back. By combining RSI and LRC, this strategy aims to confirm potential trading signals to increase the success rate of trades.
Strategy Advantages
- Combines a momentum indicator (RSI) and a trend-following indicator (LRC) for a more comprehensive market analysis.
- By waiting for the price to touch the upper or lower bands of the linear regression channel and confirming the overbought or oversold state of RSI, the strategy can filter out some false signals.
- The strategy logic is clear and easy to understand and implement.
- Can be applied to different timeframes, such as daily and 4-hour charts, providing some flexibility.
Strategy Risks
- In choppy markets or when the trend is unclear, this strategy may generate more false signals.
- The choice of parameters for RSI and LRC may affect the performance of the strategy, and inappropriate parameter settings may lead to strategy failure.
- The strategy does not consider risk management, such as stop-loss and position sizing, which may lead to large drawdowns.
- The performance of the strategy may vary depending on market conditions and may not perform well in certain market environments.
Strategy Optimization Directions
- Introduce more technical indicators or market sentiment indicators to improve the reliability of signals.
- Optimize the parameter settings for RSI and LRC to adapt to different market conditions and trading instruments.
- Introduce risk management measures, such as stop-loss and dynamic position sizing, to control potential losses.
- Consider adding a trend filter to avoid trading in choppy markets.
- Backtest and optimize the strategy to determine the best parameter combinations and trading rules.
Summary
The RSI and Linear Regression Channel Trading Strategy attempts to capture overbought and oversold opportunities in the market by combining momentum and trend-following indicators. The advantages of this strategy include its clear logic, ease of implementation, and applicability to different timeframes. However, the strategy also has some risks, such as false signals, parameter sensitivity, and lack of risk management. To improve the performance of the strategy, one can consider introducing more indicators, optimizing parameter settings, incorporating risk management measures, and adding trend filters. Overall, this strategy provides a framework for trading based on RSI and LRC but still requires further optimization and refinement.
- 1