资源加载中... loading...

EMA and Bollinger Bands Breakout Strategy

Author: ChaoZhang, Date: 2024-06-03 16:23:06
Tags: EMABB

img

Overview

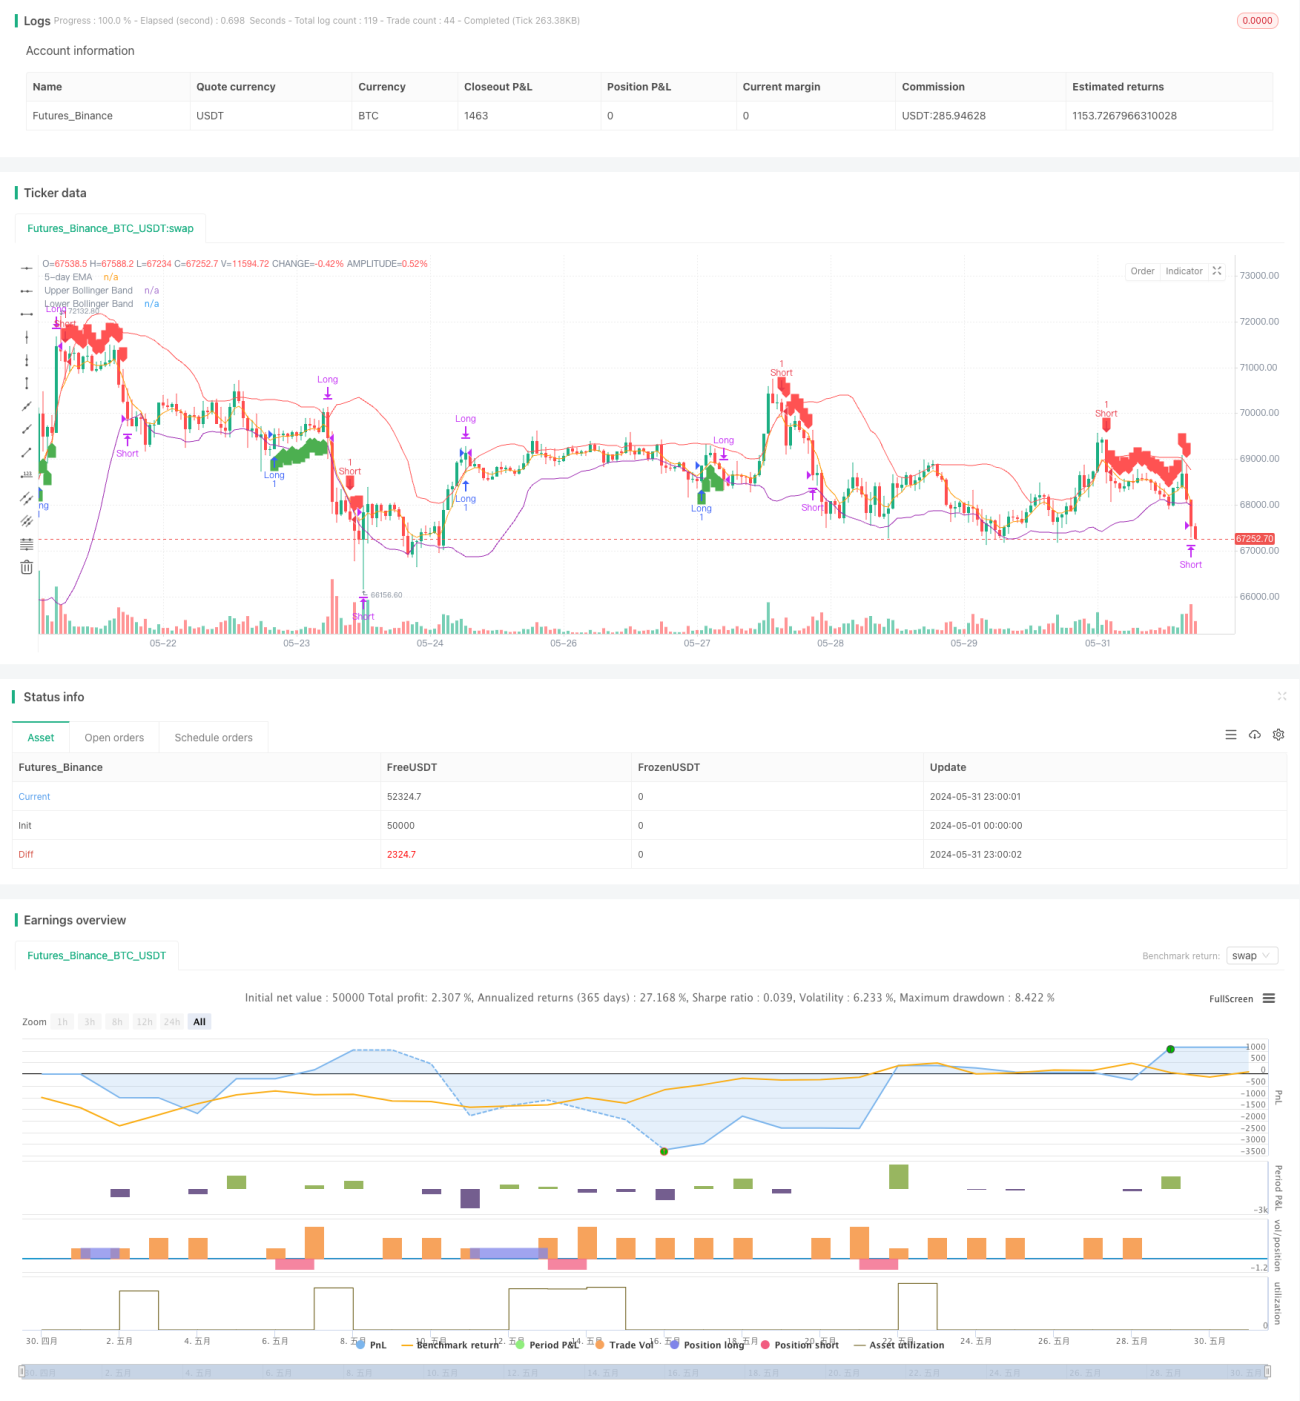
This strategy utilizes the 5-day Exponential Moving Average (EMA) and Bollinger Bands (BB) to identify potential trading opportunities in the market. When the price breaks out above the upper Bollinger Band or below the lower Bollinger Band, and specific conditions are met, the strategy generates buy or sell signals. The strategy aims to capture significant price movements in the market while using stop loss and target price levels to manage risk and maximize returns.

Strategy Principles

The core of this strategy is to use the 5-day EMA and Bollinger Bands to determine market trends and volatility. When the price breaks above the upper Bollinger Band, and the previous candle’s high is above the 5-day EMA, the strategy generates a sell signal. Conversely, when the price breaks below the lower Bollinger Band, and the previous candle’s low is below the 5-day EMA, the strategy generates a buy signal. This approach helps identify potential trend reversals or breakout points.

Once a trade is entered, the strategy sets a stop loss level and a target price level. The stop loss is placed in the opposite direction of the entry price to limit potential losses. The target price level is calculated based on a fixed number of points (e.g., 1000 points) to lock in expected profits. If the price reaches the stop loss level or the target price level, the strategy closes the trade and exits the position.

Strategy Advantages

  1. By using both EMA and Bollinger Bands, the strategy provides a more comprehensive assessment of market trends and volatility.
  2. Clear entry conditions help identify high-probability trading opportunities.
  3. Setting stop loss and target price levels effectively manages risk and locks in profits.
  4. The strategy logic is straightforward and easy to understand and implement.

Strategy Risks

  1. During periods of increased market volatility, Bollinger Bands may generate frequent trading signals, leading to over-trading and increased transaction costs.
  2. In choppy or trendless markets, the strategy may generate false signals, resulting in losses.
  3. Fixed stop loss and target price levels may not adapt well to different market conditions, limiting the strategy’s flexibility.

Strategy Optimization Directions

  1. Consider using adaptive stop loss and target price levels that dynamically adjust based on market volatility and trend strength to improve the strategy’s adaptability.
  2. Introduce additional technical indicators or signal filtering mechanisms, such as the Relative Strength Index (RSI) or Average True Range (ATR), to confirm trends and reduce false signals.
  3. Optimize the parameters, such as adjusting the EMA period, Bollinger Bands’ standard deviation multiplier, etc., to suit different market characteristics and trading instruments.

Summary

The EMA and Bollinger Bands Breakout Strategy leverages two commonly used technical indicators to capture significant price movements in the market. The strategy has clear entry conditions, risk management measures, and profit targets, making it easy to understand and implement. However, the strategy’s performance may be influenced by market volatility and trendless conditions. By introducing adaptive parameters, signal filtering mechanisms, and parameter optimization, the strategy’s robustness and profitability can be further enhanced.


/*backtest
start: 2024-05-01 00:00:00
end: 2024-05-31 23:59:59
period: 1h
basePeriod: 15m
exchanges: [{"eid":"Futures_Binance","currency":"BTC_USDT"}]
*/

//@version=5
strategy("Nifty Bank Strategy", overlay=true)

// Parameters
lengthEMA = 5
lengthBB = 20
multBB = 1.5
targetPoints = 1000

// Calculate 5-day EMA
ema5 = ta.ema(close, lengthEMA)

// Calculate Bollinger Bands (length 20, multiplier 1.5)
basis = ta.sma(close, lengthBB)
dev = multBB * ta.stdev(close, lengthBB)
upperBB = basis + dev
lowerBB = basis - dev

// Define strategy variables
var float entryPrice = na
var float stopLoss = na
var float targetPrice = na
var bool inTrade = false
var bool isLong = false
var float triggerHigh = na
var float triggerLow = na
var float triggerClose = na

if not inTrade
    // Short Entry Trigger Condition
    if low > ema5 and low > upperBB and high > upperBB
        triggerLow := low
        triggerHigh := high
        triggerClose := close
        label.new(bar_index, high, "Waiting for short trigger", color=color.yellow)
    // Long Entry Trigger Condition
    else if high < ema5 and high < lowerBB and low < lowerBB
        triggerHigh := high
        triggerLow := low
        triggerClose := close
        label.new(bar_index, low, "Waiting for long trigger", color=color.yellow)

// Check for Short Entry
if not inTrade and na(triggerClose) == false and close < triggerClose
    if low < triggerLow
        entryPrice := close
        stopLoss := triggerHigh
        targetPrice := entryPrice - targetPoints
        strategy.entry("Short", strategy.short)
        label.new(bar_index, high, "Short", color=color.red, style=label.style_label_down)
        inTrade := true
        isLong := false
        triggerLow := na
        triggerHigh := na
        triggerClose := na

// Check for Long Entry
if not inTrade and na(triggerClose) == false and close > triggerClose
    if high > triggerHigh
        entryPrice := close
        stopLoss := triggerLow
        targetPrice := entryPrice + targetPoints
        strategy.entry("Long", strategy.long)
        label.new(bar_index, low, "Long", color=color.green, style=label.style_label_up)
        inTrade := true
        isLong := true
        triggerLow := na
        triggerHigh := na
        triggerClose := na

// Manage Short Trade
if inTrade and not isLong
    if high >= stopLoss
        strategy.close("Short", comment="SL Hit")
        label.new(bar_index, high, "SL Hit", color=color.red, style=label.style_label_down)
        inTrade := false
    else if low <= targetPrice
        strategy.close("Short", comment="Target Hit")
        label.new(bar_index, low, "Target Hit", color=color.green, style=label.style_label_up)
        inTrade := false

// Manage Long Trade
if inTrade and isLong
    if low <= stopLoss
        strategy.close("Long", comment="SL Hit")
        label.new(bar_index, low, "SL Hit", color=color.red, style=label.style_label_down)
        inTrade := false
    else if high >= targetPrice
        strategy.close("Long", comment="Target Hit")
        label.new(bar_index, high, "Target Hit", color=color.green, style=label.style_label_up)
        inTrade := false

// Plotting
plot(ema5, color=color.orange, title="5-day EMA")
plot(upperBB, color=color.red, title="Upper Bollinger Band")
plot(lowerBB, color=color.purple, title="Lower Bollinger Band")

// Plot trade entry and exit points
plotshape(series=inTrade and isLong ? entryPrice : na, location=location.belowbar, color=color.green, style=shape.labelup, title="Buy Signal")
plotshape(series=inTrade and not isLong ? entryPrice : na, location=location.abovebar, color=color.red, style=shape.labeldown, title="Sell Signal")

template: strategy.tpl:40:21: executing "strategy.tpl" at <.api.GetStrategyListByName>: wrong number of args for GetStrategyListByName: want 7 got 6