概述
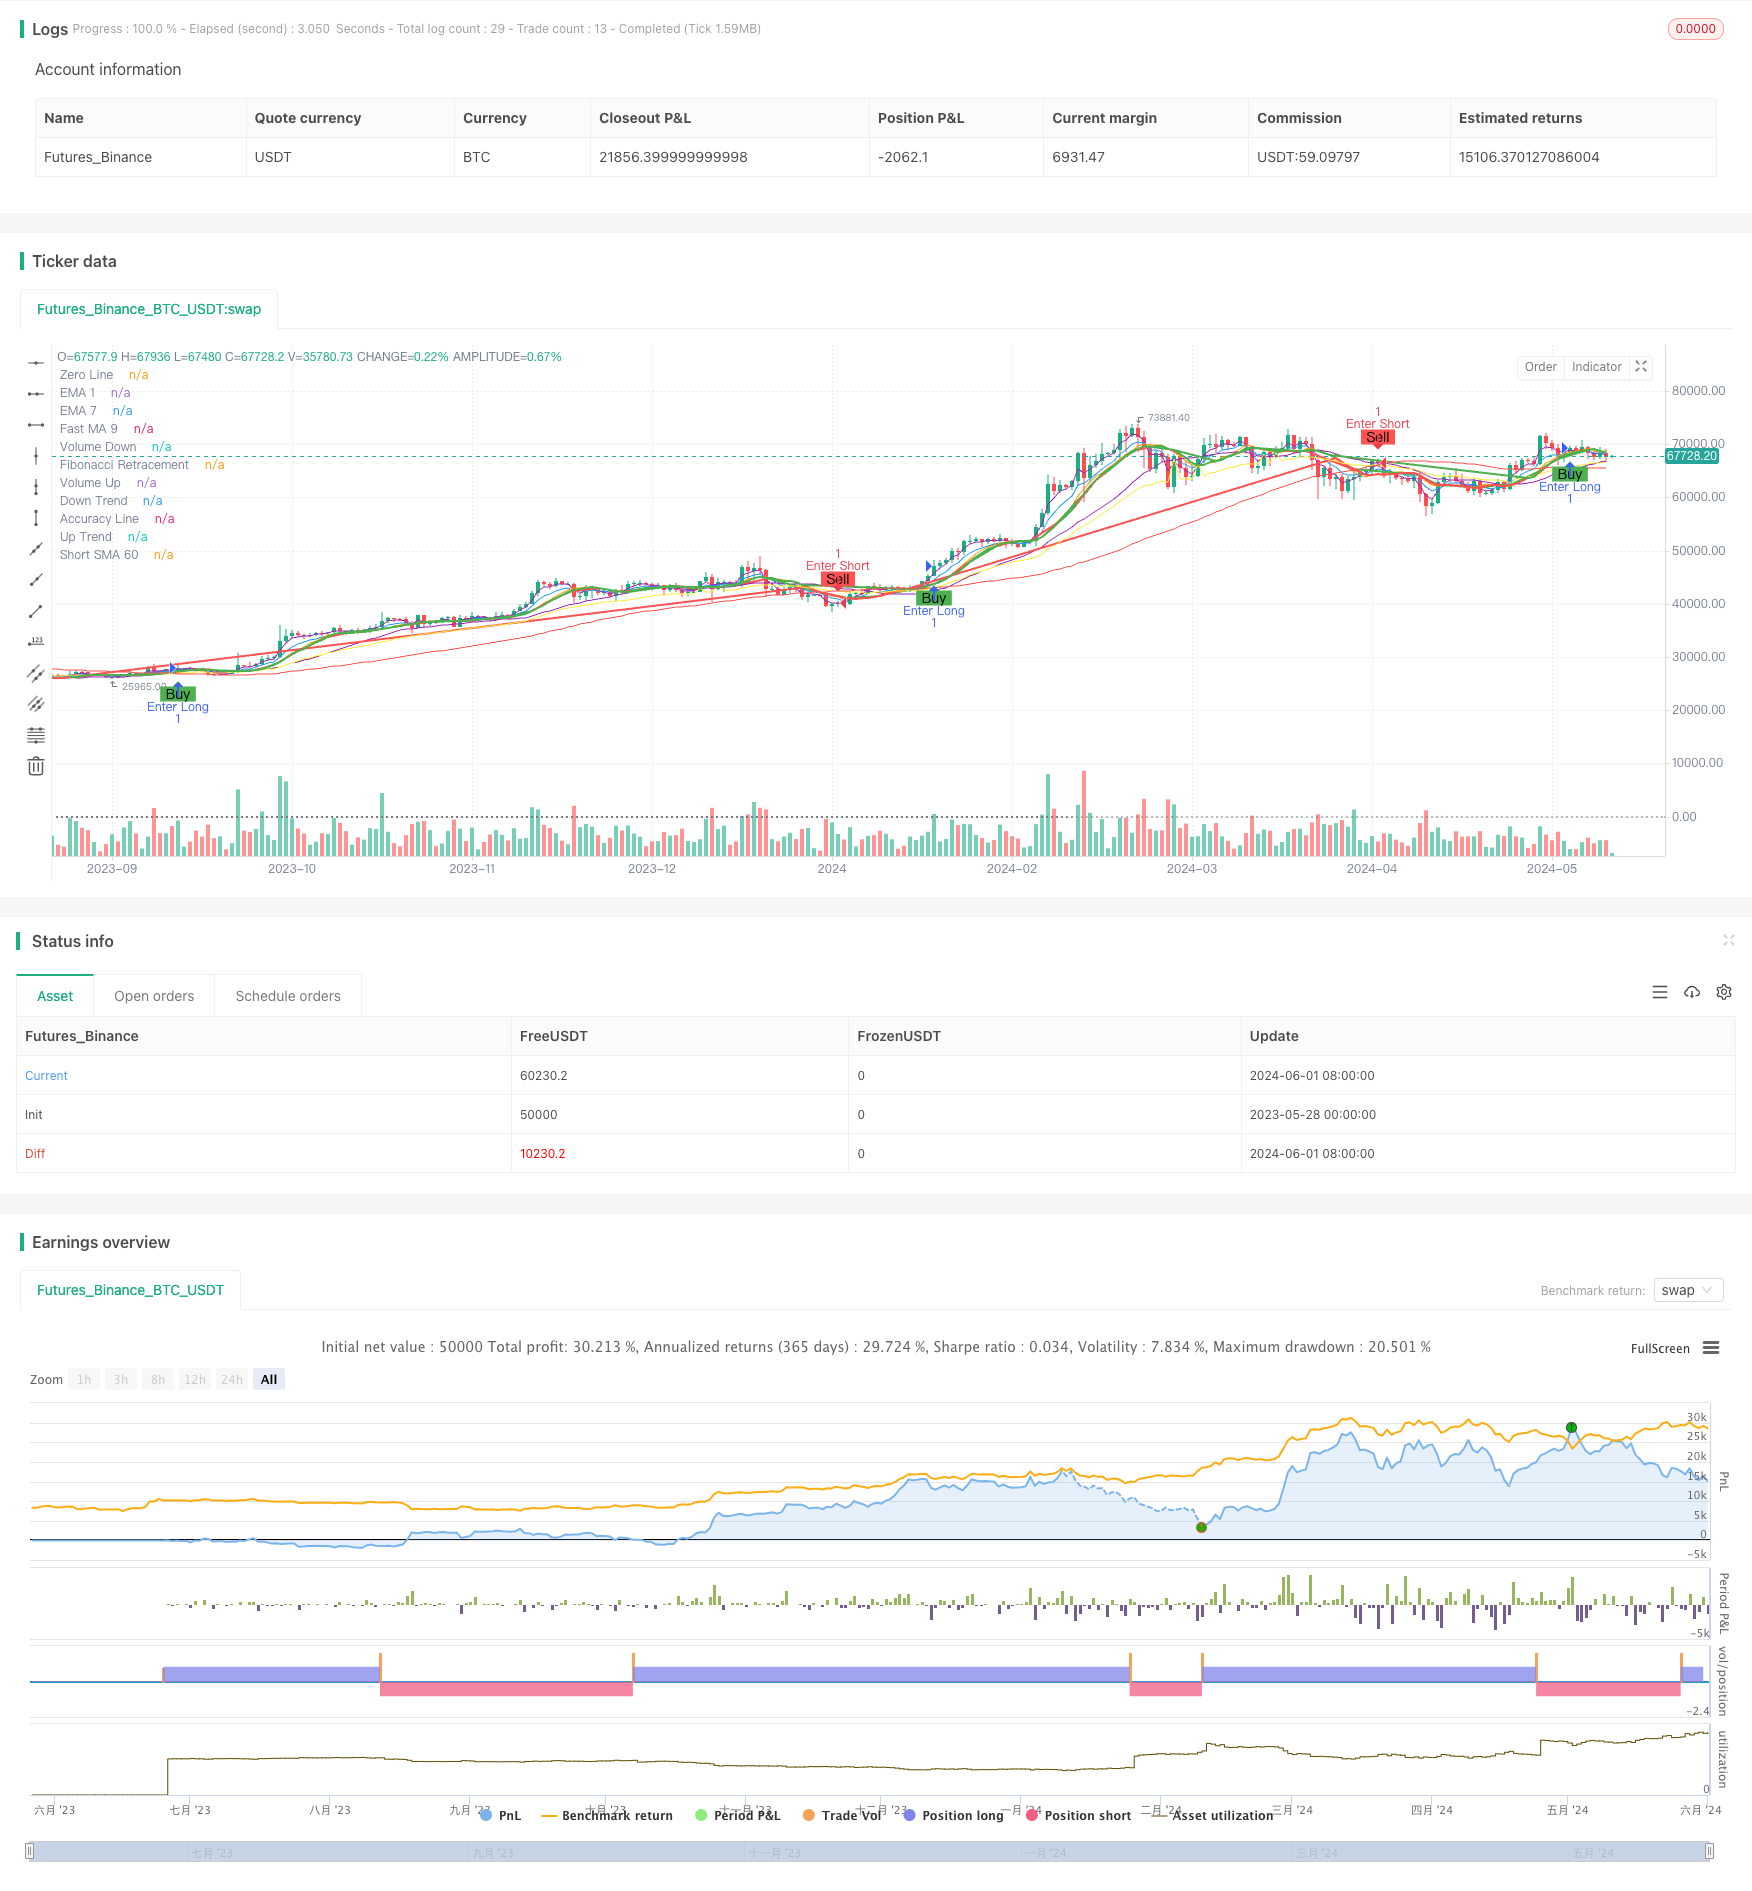
该策略结合了价格和交易量的信号,以及斐波那契回撤水平,在15分钟和45分钟的时间框架内产生买卖信号。策略使用了多个移动平均线(MA)作为趋势和动量的指标,包括简单移动平均线(SMA)和指数移动平均线(EMA)。此外,还使用了斐波那契回撤水平作为潜在的进场点。该策略的主要目标是在价格和交易量出现显著变化时及时捕捉买卖机会。
策略原理
- 计算快速MA(默认为10)和慢速MA(默认为30),当快速MA高于慢速MA时表示上升趋势,反之则表示下降趋势。
- 计算交易量MA(默认为20),当前交易量高于交易量MA表示交易量增加,反之则表示交易量减少。
- 使用多个MA和EMA作为辅助指标,包括快速MA(默认为9)、短期SMA(默认为10和60)和EMA(默认为3和7)。
- 计算斐波那契回撤水平(0.47、0.658和0.886),作为潜在的支撑位和阻力位。
- 当短期SMA(60)与精确度线(基于快速EMA和慢速EMA的交叉)发生交叉时,产生买入或卖出信号。
- 当快速MA(9)与EMA(7)交叉时,产生平仓信号。
优势分析
- 结合了价格和交易量的信息,提供更全面的市场分析。
- 使用多个MA和EMA作为辅助指标,有助于确认趋势和动量的变化。
- 斐波那契回撤水平为潜在的进场点提供了参考,有助于优化进场时机。
- 买卖信号基于短期SMA和精确度线的交叉,有助于及时捕捉市场转折点。
- 平仓信号基于快速MA和EMA的交叉,有助于及时锁定利润或止损。
风险分析
- 在震荡市场中,频繁的交叉信号可能导致过多的交易和手续费损失。
- 策略依赖于历史数据计算的MA和斐波那契水平,可能无法及时适应市场的突发变化。
- 策略缺乏对市场趋势强度的评估,在趋势较弱时可能产生错误信号。
- 策略的参数(如MA周期)需要根据不同的市场状况进行优化,否则可能影响策略的有效性。
优化方向
- 引入趋势强度指标(如ADX),在趋势较弱时避免交易或采取更保守的策略。
- 优化MA和EMA的周期参数,以适应不同的市场状况和交易品种。
- 结合其他技术指标(如RSI、MACD)以提高信号的可靠性。
- 引入止损和止盈机制,以控制单笔交易的风险敞口。
- 对于震荡市场,考虑采用更适合的交易策略(如范围交易)。
总结
该策略通过结合价格、交易量和斐波那契回撤水平,在多个时间框架内产生买卖信号。策略的优势在于综合考虑了多个市场要素,并使用了多个MA和EMA作为辅助指标。然而,策略在震荡市场中可能产生过多的交易信号,并且依赖于历史数据计算的指标,因此需要进一步优化以提高其适应性和可靠性。优化方向包括引入趋势强度指标、优化参数、结合其他技术指标以及引入风险管理措施等。
策略源码
/*backtest
start: 2023-05-28 00:00:00
end: 2024-06-02 00:00:00
period: 1d
basePeriod: 1h
exchanges: [{"eid":"Futures_Binance","currency":"BTC_USDT"}]
*/

//@version=5
strategy(title="Buy/Sell with Volume and Candlestick Signals", overlay=true)

// Fibonacci Retracement Levels
var float[] fibonacciLevels = array.new_float(5)
array.set(fibonacciLevels, 2, 0.47)
array.set(fibonacciLevels, 3, 0.658)
array.set(fibonacciLevels, 4, 0.886)

// Calculate Fibonacci Retracement Levels
fibonacciRetrace(highLevel, lowLevel) =>
    priceRange = highLevel - lowLevel
    retracementLevels = array.new_float(0)
    for i = 0 to array.size(fibonacciLevels) - 1
        level = highLevel - array.get(fibonacciLevels, i) * priceRange
        array.push(retracementLevels, level)
    retracementLevels

fibRetracementValues = fibonacciRetrace(high, low)
fibRetracement = ta.sma(close, 21)
plot(fibRetracement, color=color.purple, title="Fibonacci Retracement")

// Define inputs
fast_ma = input.int(title="Fast MA Period", defval=10)
short_sma_10 = input.int(title="Short SMA 10 Period", defval=10)
short_sma_60 = input.int(title="Short SMA 60 Period", defval=60)
slow_ma = input.int(title="Slow MA Period", defval=30)
ema1Length = input.int(title="EMA 1 Length", defval=3)
fast_ma_9 = input.int(title="Fast MA 9", defval=9)

// Define indicators
fast_ma_val = ta.sma(close, fast_ma)
short_sma_10_val = ta.sma(close, short_sma_10)
short_sma_60_val = ta.sma(close, short_sma_60)
slow_ma_val = ta.sma(close, slow_ma)
up_trend = fast_ma_val > slow_ma_val
down_trend = fast_ma_val < slow_ma_val
volume_up = volume > ta.sma(volume, 20)
volume_down = volume < ta.sma(volume, 20)

// Calculate accuracy values
fast_ema_val = ta.ema(close, fast_ma)
slow_ema_val = ta.ema(close, slow_ma)
ema1_val = ta.ema(close, ema1Length)
fast_ma_9_val = ta.sma(close, fast_ma_9)
ema7_val = ta.ema(close, 7)
accuracy = ta.crossover(close, slow_ma_val) ? fast_ema_val : slow_ema_val

// Define lines
plot(up_trend ? fast_ma_val : na, color=color.green, linewidth=2, title="Up Trend")
plot(down_trend ? fast_ma_val : na, color=color.red, linewidth=2, title="Down Trend")
plot(volume_up ? fast_ma_val : na, color=color.green, linewidth=2, title="Volume Up")
plot(volume_down ? fast_ma_val : na, color=color.red, linewidth=2, title="Volume Down")
plot(accuracy, color=color.yellow, linewidth=1, title="Accuracy Line")
plot(ema1_val, color=color.purple, linewidth=1, title="EMA 1")
plot(fast_ma_9_val, color=color.orange, linewidth=1, title="Fast MA 9")
plot(ema7_val, color=color.blue, linewidth=1, title="EMA 7")
plot(short_sma_60_val, color=color.red, linewidth=1, title="Short SMA 60")
hline(0, color=color.gray, linestyle=hline.style_dotted, title="Zero Line")

// Buy/Sell Signals
buySignal = ta.crossunder(short_sma_60_val, accuracy)
sellSignal = ta.crossover(short_sma_60_val, accuracy)

// Exit Signals
exitLongSignal = ta.crossunder(fast_ma_9_val, ema7_val)
exitShortSignal = ta.crossover(fast_ma_9_val, ema7_val)

// Plot Buy/Sell Signals
plotshape(buySignal, title="Buy Signal", location=location.belowbar, color=color.green, style=shape.labelup, text="Buy")
plotshape(sellSignal, title="Sell Signal", location=location.abovebar, color=color.red, style=shape.labeldown, text="Sell")

if exitLongSignal
    strategy.close("Buy")

if exitShortSignal
    strategy.close("Sell")


if buySignal
    strategy.entry("Enter Long", strategy.long)
else if sellSignal
    strategy.entry("Enter Short", strategy.short)
相关推荐