Starlight Moving Average Crossover Strategy

Overview
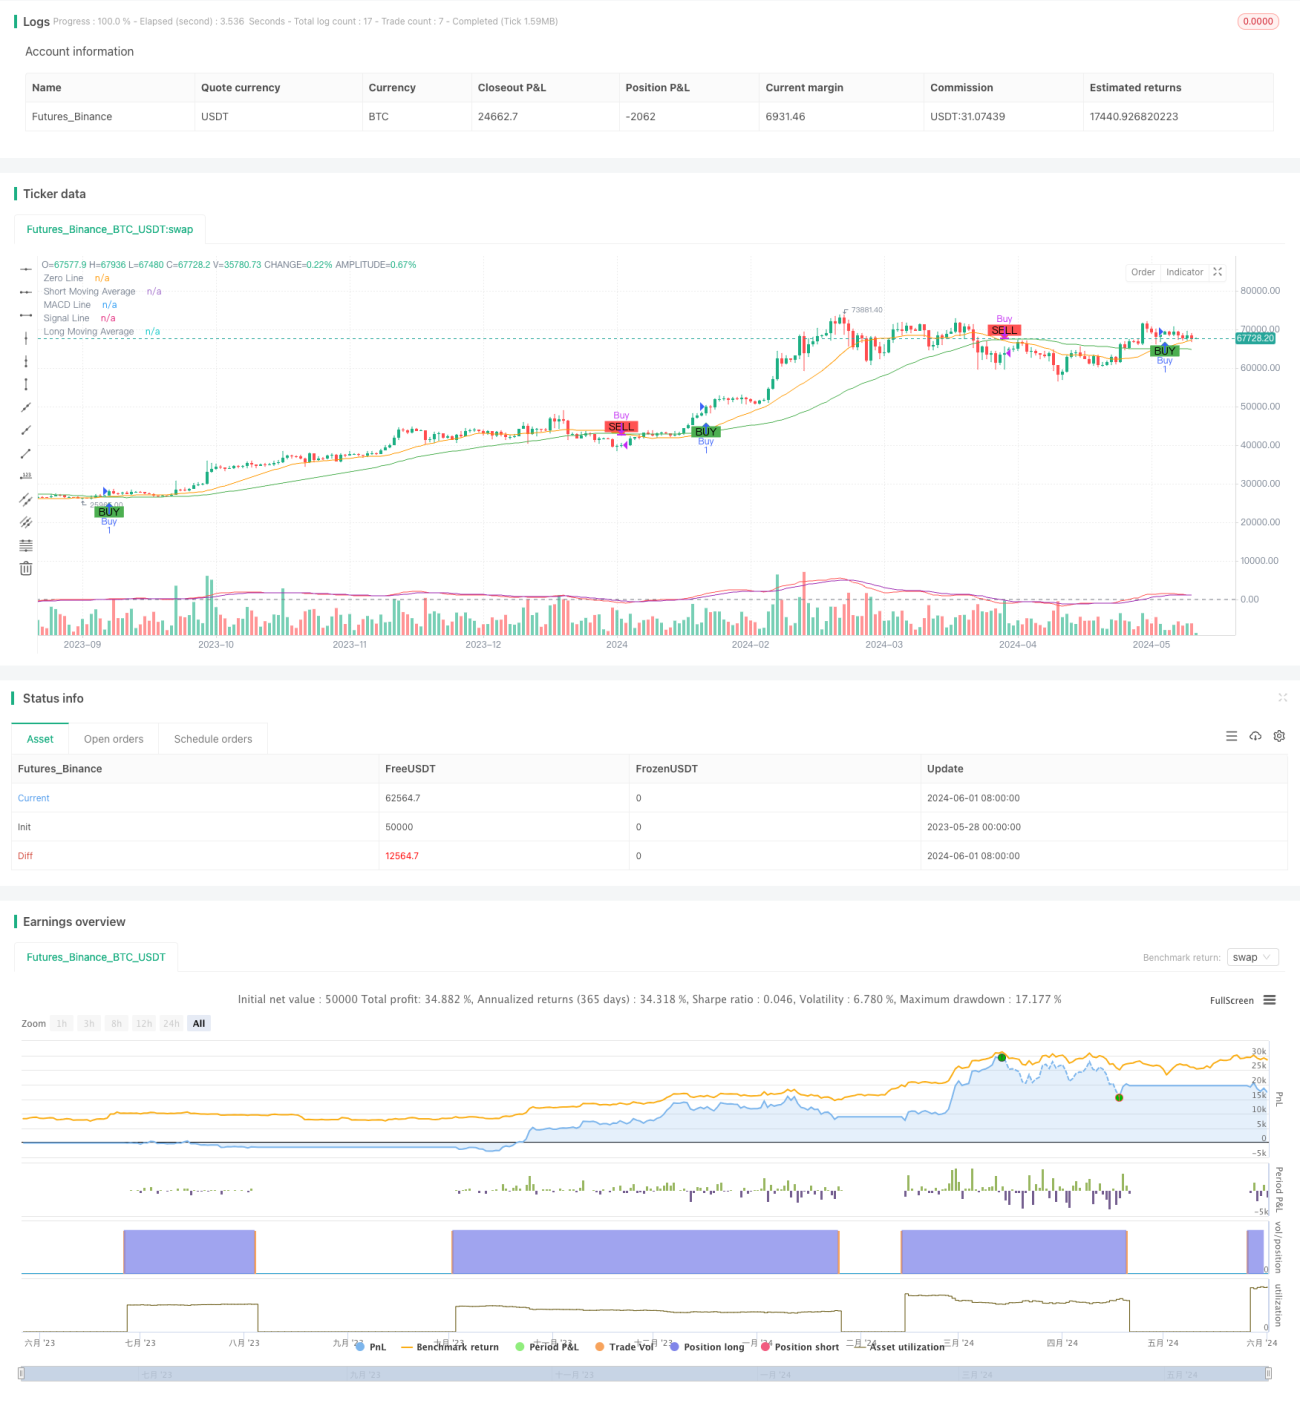
The Starlight Moving Average Crossover Strategy is a quantitative trading strategy based on moving averages and the MACD indicator. The strategy utilizes crossover signals of two simple moving averages (SMAs) with different periods to determine buying and selling opportunities, while the MACD indicator is used to assist in judging the trend and momentum. When the short-term moving average crosses above the long-term moving average, a buy signal is generated; conversely, when the short-term moving average crosses below the long-term moving average, a sell signal is generated. This strategy aims to capture medium to long-term market trends while using the MACD indicator to confirm the strength and sustainability of the trend.
Strategy Principle
The core principle of the Starlight Moving Average Crossover Strategy is to use crossover signals of moving averages with different periods to identify changes in market trends. When the short-term moving average crosses above the long-term moving average from below, it indicates that a new uptrend may be forming, and the strategy generates a buy signal. Conversely, when the short-term moving average crosses below the long-term moving average from above, it indicates that a new downtrend may be forming, and the strategy generates a sell signal.
In addition to using moving average crossover signals, the strategy also incorporates the MACD indicator as an auxiliary judgment tool. The MACD consists of two lines: the MACD line and the signal line. When the MACD line crosses above the signal line from below, it indicates increasing upward momentum in the market; conversely, when the MACD line crosses below the signal line from above, it indicates increasing downward momentum in the market. The MACD indicator can be used to confirm the validity of moving average crossover signals and improve the reliability of the strategy.
Strategy Advantages
- Simplicity: The Starlight Moving Average Crossover Strategy is based on simple moving averages and the MACD indicator, making it clear, easy to understand, and implement.
- Trend following: By using moving averages with different periods, the strategy can effectively capture medium to long-term market trends, helping investors align with the primary market direction.
- Signal confirmation: Incorporating the MACD indicator as an auxiliary judgment tool can improve the reliability of moving average crossover signals and reduce false signals.
- Adaptability: The strategy can be adapted to different market environments and investor preferences by adjusting the periods of moving averages and the parameters of the MACD indicator.
Strategy Risks
- Lag: Moving averages are lagging indicators, and they react relatively slowly to market changes, which may lead to missing the best buying and selling opportunities.
- Oscillating markets: In highly volatile markets without clear trends, frequent moving average crossover signals may lead to excessive trading, increasing transaction costs and risks.
- Parameter sensitivity: The performance of the strategy largely depends on the selected periods of moving averages and the parameters of the MACD indicator. Inappropriate parameter settings may render the strategy ineffective.
Strategy Optimization Directions
- Parameter optimization: Optimize the periods of moving averages and the parameters of the MACD indicator to adapt to different market environments and asset characteristics, improving the robustness and profitability of the strategy.
- Signal filtering: Introduce other technical indicators or market sentiment indicators to filter moving average crossover signals, reducing false signals and noise interference.
- Risk management: Combine stop-loss and position sizing strategies to control the risk exposure of individual trades and prevent significant losses.
- Multi-market testing: Test the strategy on different markets and assets to assess its applicability and robustness, making necessary adjustments to the strategy.
Summary
The Starlight Moving Average Crossover Strategy is a quantitative trading strategy based on trend following and momentum confirmation. It utilizes crossover signals of moving averages with different periods and the MACD indicator to capture medium to long-term market trends. The strategy has advantages such as simplicity, trend following, signal confirmation, and adaptability. However, it also has risks such as lag, oscillating markets, and parameter sensitivity. To further enhance the performance of the strategy, optimizations and improvements can be made in aspects such as parameter optimization, signal filtering, risk management, and multi-market testing. Overall, the Starlight Moving Average Crossover Strategy provides quantitative traders with a trading framework based on classic technical indicators, but it requires adjustments and optimizations based on specific market conditions and personal preferences in practical applications.
- 1