Dynamic Timeframe High-Low Breakout Strategy

Overview
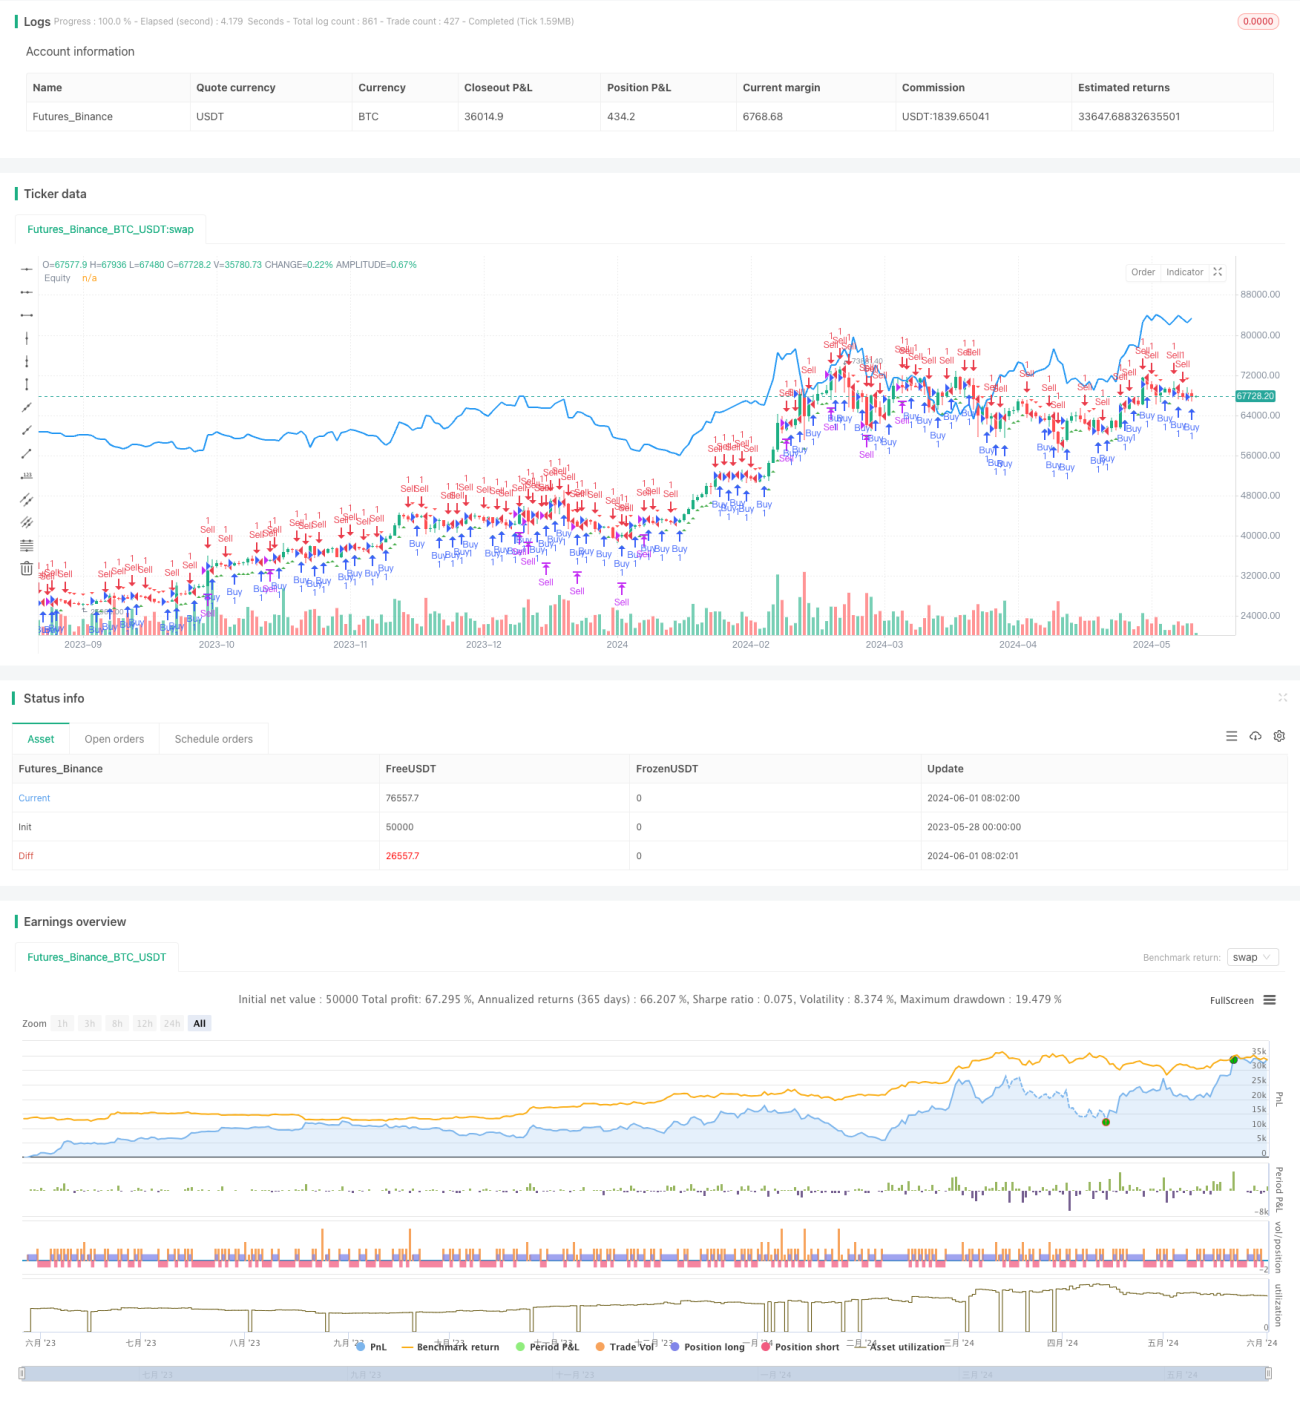
This strategy uses dynamic timeframe high-low breakouts to generate trading signals. It determines whether to buy or sell by comparing the highest and lowest prices of the current timeframe with the closing price of the previous timeframe plus or minus a certain number of points. This approach can adapt to different market trends and volatility, thus improving the adaptability and flexibility of the strategy.
Strategy Principles
The core of this strategy is to use the high and low points of different timeframes to determine price trends. First, it obtains the highest price, lowest price, and closing price data corresponding to the user-selected timeframe. Then, it determines the buy signal by comparing whether the highest price of the current timeframe is greater than the closing price of the previous timeframe plus a certain number of points. Similarly, it determines the sell signal by comparing whether the lowest price of the current timeframe is less than the closing price of the previous timeframe minus a certain number of points. Once a buy or sell signal appears, the strategy will open or close positions accordingly. In addition, the strategy will mark the buy and sell signals on the chart and plot the equity curve of the strategy for intuitive evaluation of the strategy performance.
Strategy Advantages
- Strong adaptability: By using dynamic timeframes, the strategy can adapt to different market environments and volatility characteristics, improving the adaptability and stability of the strategy.
- Simple and easy to understand: The strategy logic is clear, easy to understand and implement, and does not require complex mathematical models or machine learning algorithms.
- High flexibility: Users can adjust the timeframe and point threshold according to their preferences and experience to optimize strategy performance.
- Intuitive and clear: By marking buy and sell signals on the chart and plotting the equity curve, users can intuitively evaluate the performance and risk of the strategy.
Strategy Risks
- Parameter sensitivity: The performance of the strategy may be sensitive to parameters such as timeframe and point threshold, and inappropriate parameter settings may lead to poor strategy performance.
- Overfitting risk: If the parameters are over-optimized to historical data, it may lead to poor performance of the strategy in actual application.
- Market risk: The performance of the strategy may be affected by market emergencies, policy changes and other factors, resulting in losses.
Strategy Optimization Directions
- Dynamic adjustment of parameters: According to market conditions and strategy performance, dynamically adjust parameters such as timeframe and point threshold to adapt to market changes and improve strategy stability.
- Introducing risk management: Introduce risk control measures such as stop-loss and position management in the strategy to reduce the risk exposure and drawdown of a single transaction.
- Combine with other indicators: Combine this strategy with other technical indicators or fundamental factors to form a more robust and comprehensive trading system.
- Optimize code efficiency: Optimize and improve the code to increase the execution efficiency and speed of the strategy, and reduce the impact of delays and slippage.
Summary
The dynamic timeframe high-low breakout strategy generates trading signals based on price breakouts of high and low points in different timeframes. The strategy logic is clear, adaptable, and easy to implement and optimize. However, it also has problems such as parameter sensitivity, overfitting, and market risk, which need to be continuously optimized and improved in actual application. By dynamically adjusting parameters, introducing risk management, combining with other indicators, and optimizing code efficiency, the robustness and profitability of the strategy can be further improved, providing effective tools and ideas for quantitative trading.
- 1