Elliott Wave Stochastic EMA Strategy

Overview
This strategy uses a combination of Elliott Wave theory, the Stochastic indicator, and Exponential Moving Averages (EMAs). Elliott Wave theory is used to identify market trends and buy/sell conditions, the Stochastic indicator is used to measure the strength of the current trend, and EMAs are used to visualize the overall market trend as well as support and resistance levels. The combination of these three techniques can help traders identify trading opportunities and make informed decisions about the market.
Strategy Principles
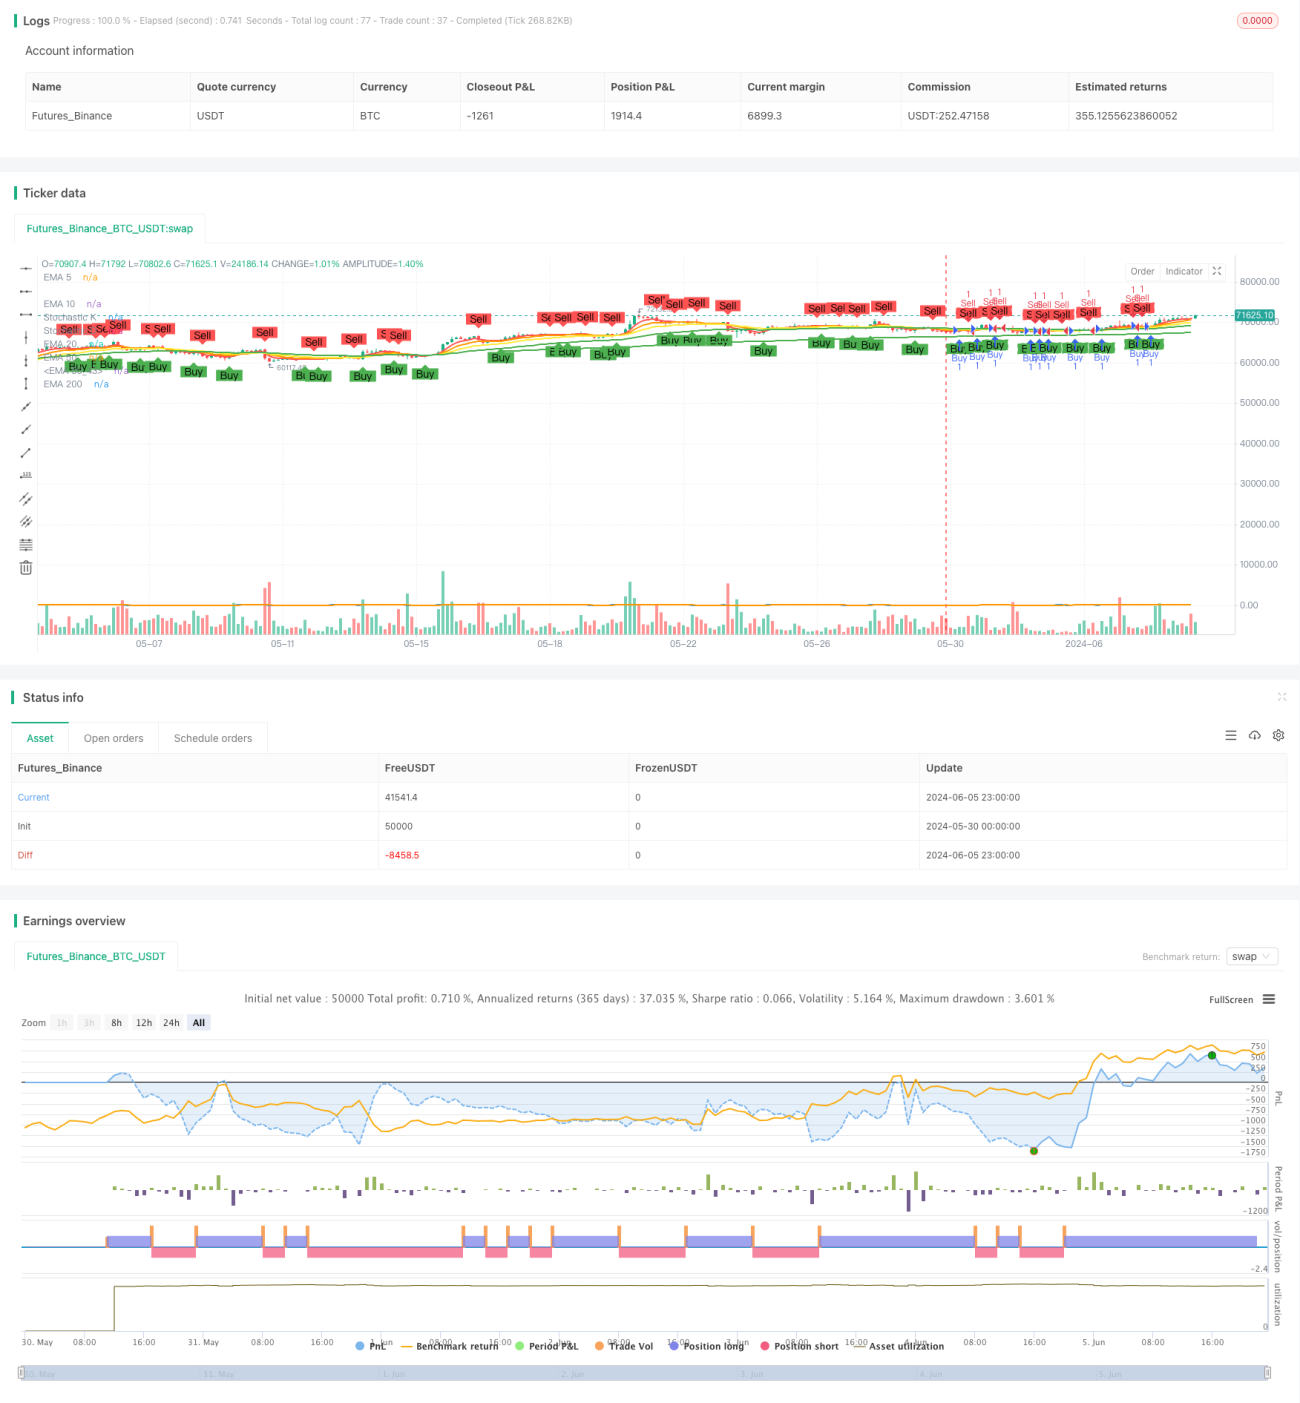
The strategy first uses Elliott Wave theory to identify market trends. A buy signal is generated when the closing price breaks above the 5-day EMA, and a sell signal is generated when the closing price breaks below the 5-day EMA. This helps to capture the start and end of trends.
Next, the strategy uses the Stochastic indicator to measure the strength of the current trend. The Stochastic indicator consists of two lines: the %K line and the %D line. The %K line measures the closing price relative to the high and low of a recent period, and the %D line is a moving average of the %K line. When the %K line is above the %D line, it indicates a strong uptrend; when the %K line is below the %D line, it indicates a strong downtrend.
Finally, the strategy uses five EMAs of different periods (5, 10, 20, 50, and 200) to visualize the overall market trend. Shorter-period EMAs reflect short-term trends, while longer-period EMAs reflect long-term trends. When shorter-period EMAs are above longer-period EMAs, it indicates an uptrend; conversely, it indicates a downtrend.
Strategy Advantages
- By combining three different technical indicators, the strategy provides a comprehensive and accurate trading system.
- Elliott Wave theory and the Stochastic indicator can help identify trends and buy/sell conditions, while EMAs can visualize the overall market trend.
- Using multiple EMAs of different periods allows for a better understanding of both short-term and long-term market trends.
- The strategy uses simple yet effective rules to generate buy and sell signals, making it easy to implement and automate.
Strategy Risks
- Like all technical indicators, the strategy may not perform well in volatile or sideways markets.
- The strategy relies on historical data and may not adapt well to changing market conditions.
- The strategy does not consider fundamental factors such as economic data or geopolitical events, which could lead to false trading signals.
- Overfitting is a potential risk as the strategy uses multiple parameters and indicators.
Strategy Optimization Directions
- Consider incorporating other technical indicators such as the Relative Strength Index (RSI) or Average True Range (ATR) to improve trend identification and risk management.
- Experiment with different parameter settings, such as the periods of the EMAs or the sensitivity of the Stochastic indicator, to optimize strategy performance.
- Introduce fundamental data, such as economic calendar events or sentiment indicators, to filter out potentially false technical signals.
- Implement more sophisticated money management rules, such as adjusting position sizes based on volatility or using trailing stop-losses, to reduce risk exposure.
Summary
The Elliott Wave Stochastic EMA strategy provides a comprehensive trading system by combining Elliott Wave theory, the Stochastic indicator, and Exponential Moving Averages. It leverages these indicators to identify trends, measure trend strength, and visualize the overall market trend. While the strategy has several strengths, such as ease of implementation and trend identification capabilities, it also carries some risks, such as sensitivity to volatility and the potential for overfitting. The strategy's performance could be further enhanced by incorporating additional indicators, optimizing parameter settings, and improving money management. Overall, the Elliott Wave Stochastic EMA strategy offers a promising starting point for technical analysis, but requires caution and further backtesting in practical application.
/*backtest
start: 2024-05-30 00:00:00
end: 2024-06-06 00:00:00
period: 3h
basePeriod: 15m
exchanges: [{"eid":"Futures_Binance","currency":"BTC_USDT"}]
*/

// This Pine Script™ code is subject to the terms of the Mozilla Public License 2.0 at https://mozilla.org/MPL/2.0/
// © montanarigiuliano9

//@version=5- 1