EMA and Parabolic SAR Combination Strategy

Overview
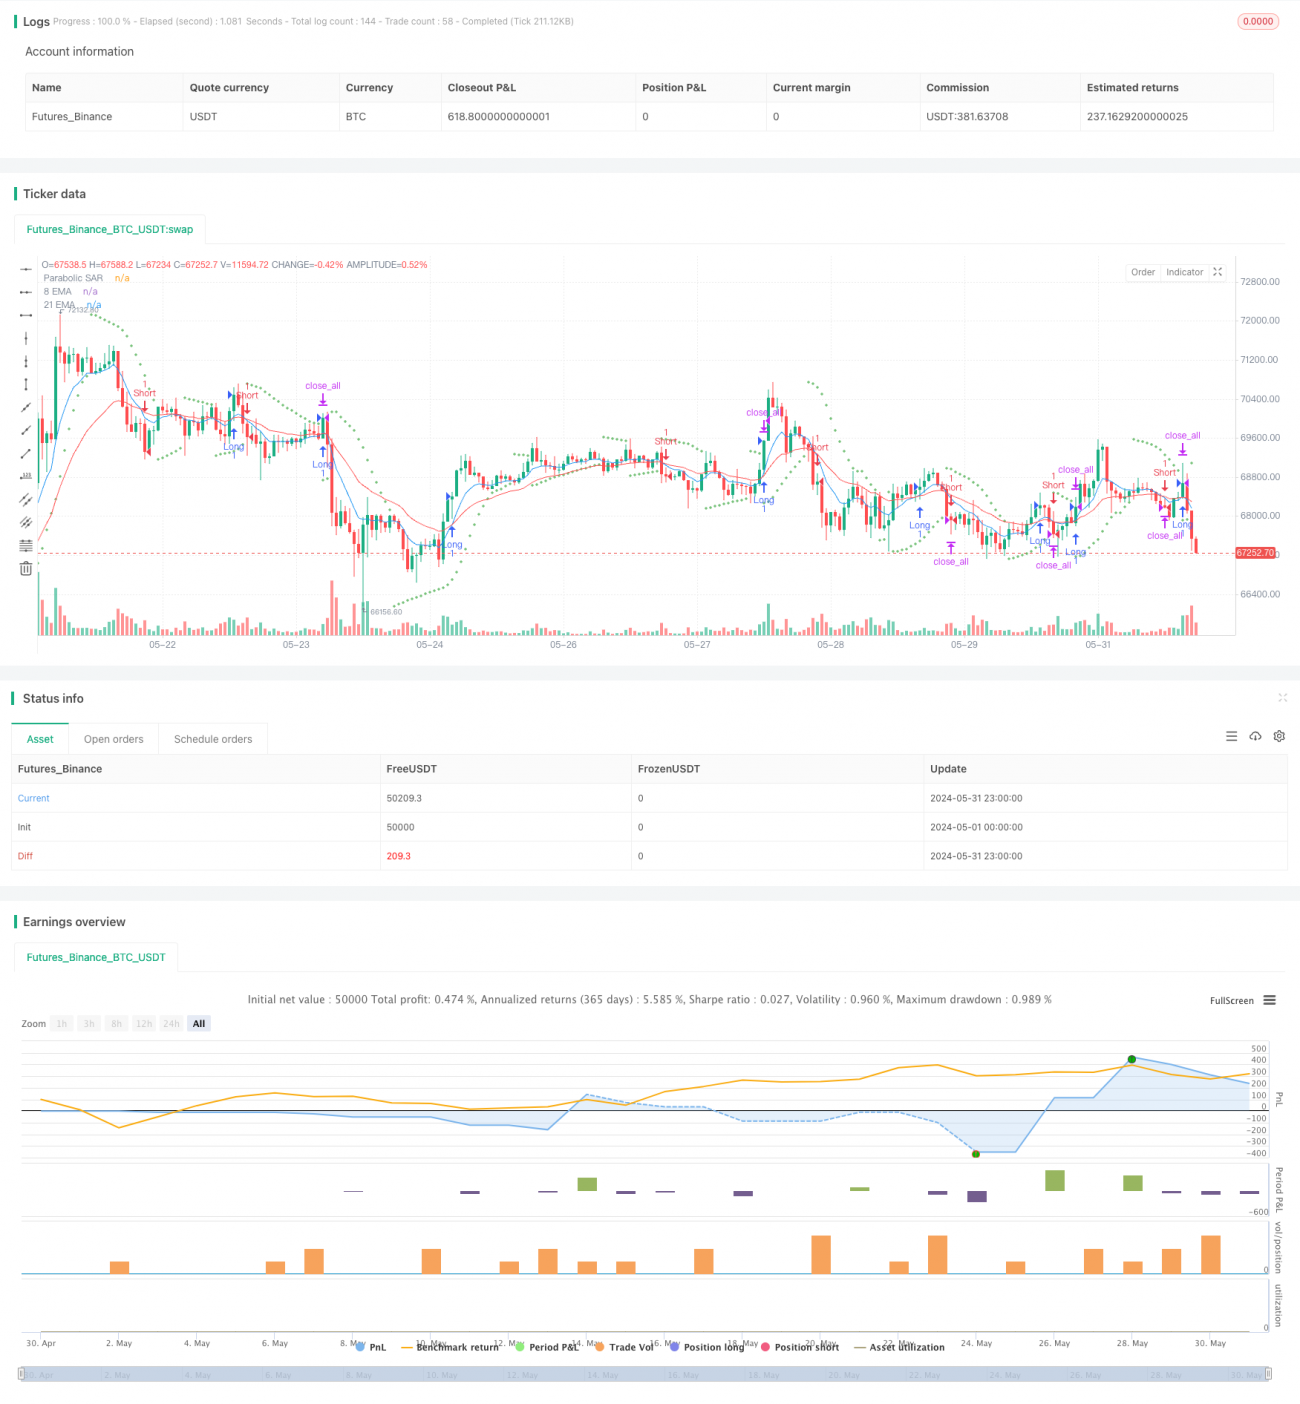
This strategy combines the 8-period and 21-period Exponential Moving Averages (EMAs) with the Parabolic SAR indicator to capture trends and manage risk. The strategy aims to open and close positions based on specific crossover and price action conditions, with defined exit rules including a fixed stop-loss and a mandatory exit at a specific time.
Strategy Principles
The strategy uses two EMAs with different periods (8-period and 21-period) and the Parabolic SAR indicator to determine entry and exit conditions. When the short-term EMA crosses above the long-term EMA and the closing price is above the SAR, the strategy opens a long position. When the short-term EMA crosses below the long-term EMA and the closing price is below the SAR, the strategy opens a short position. Long positions are closed when the closing price falls below the SAR, while short positions are closed when the closing price rises above the SAR. The strategy also sets a fixed stop-loss in points to control the risk of each trade. Additionally, the strategy requires all positions to be closed at 15:15 on each trading day.
Strategy Advantages
- Combining EMA and SAR indicators helps better capture trends and identify trend reversals.
- Fixed stop-loss helps control the risk of individual trades.
- Closing all positions at a fixed time each trading day avoids overnight holding risks.
- Adjustable parameters allow adaptation to different market conditions and trading instruments.
Strategy Risks
- EMA and SAR indicators may generate false signals, leading to losing trades.
- Fixed stop-loss points may not adapt well to market volatility, resulting in inappropriate stop-loss placement.
- In markets with unclear trends or high volatility, the strategy may frequently open and close positions, leading to high trading costs.
- The strategy lacks consideration of market sentiment and fundamental factors, potentially missing important trading opportunities.
Strategy Optimization Directions
- Introduce more technical indicators, such as RSI and MACD, to improve the reliability of entry and exit signals.
- Optimize stop-loss and take-profit rules, such as using dynamic stop-loss or volatility-based stop-loss methods, to better adapt to market changes.
- Consider incorporating market sentiment and fundamental factors, such as trading volume and news events, to enhance the comprehensiveness of the strategy.
- Perform parameter optimization and backtesting for different markets and trading instruments to find the best parameter combinations.
Summary
The EMA and Parabolic SAR Combination Strategy attempts to capture trends and control risk by combining two commonly used technical indicators. The strategy is simple and easy to understand, making it suitable for beginners to learn and use. However, the strategy also has some limitations, such as insufficient adaptability to market volatility and a lack of consideration for market sentiment and fundamental factors. Therefore, in practical applications, the strategy needs to be optimized and improved based on specific markets and trading instruments to enhance its stability and profitability.
- 1