资源加载中... loading...

Dual Trend Strategy with EMA Crossover and RSI Filter

Author: ChaoZhang, Date: 2024-06-07 15:29:57
Tags: EMARSIMACD

img

Overview

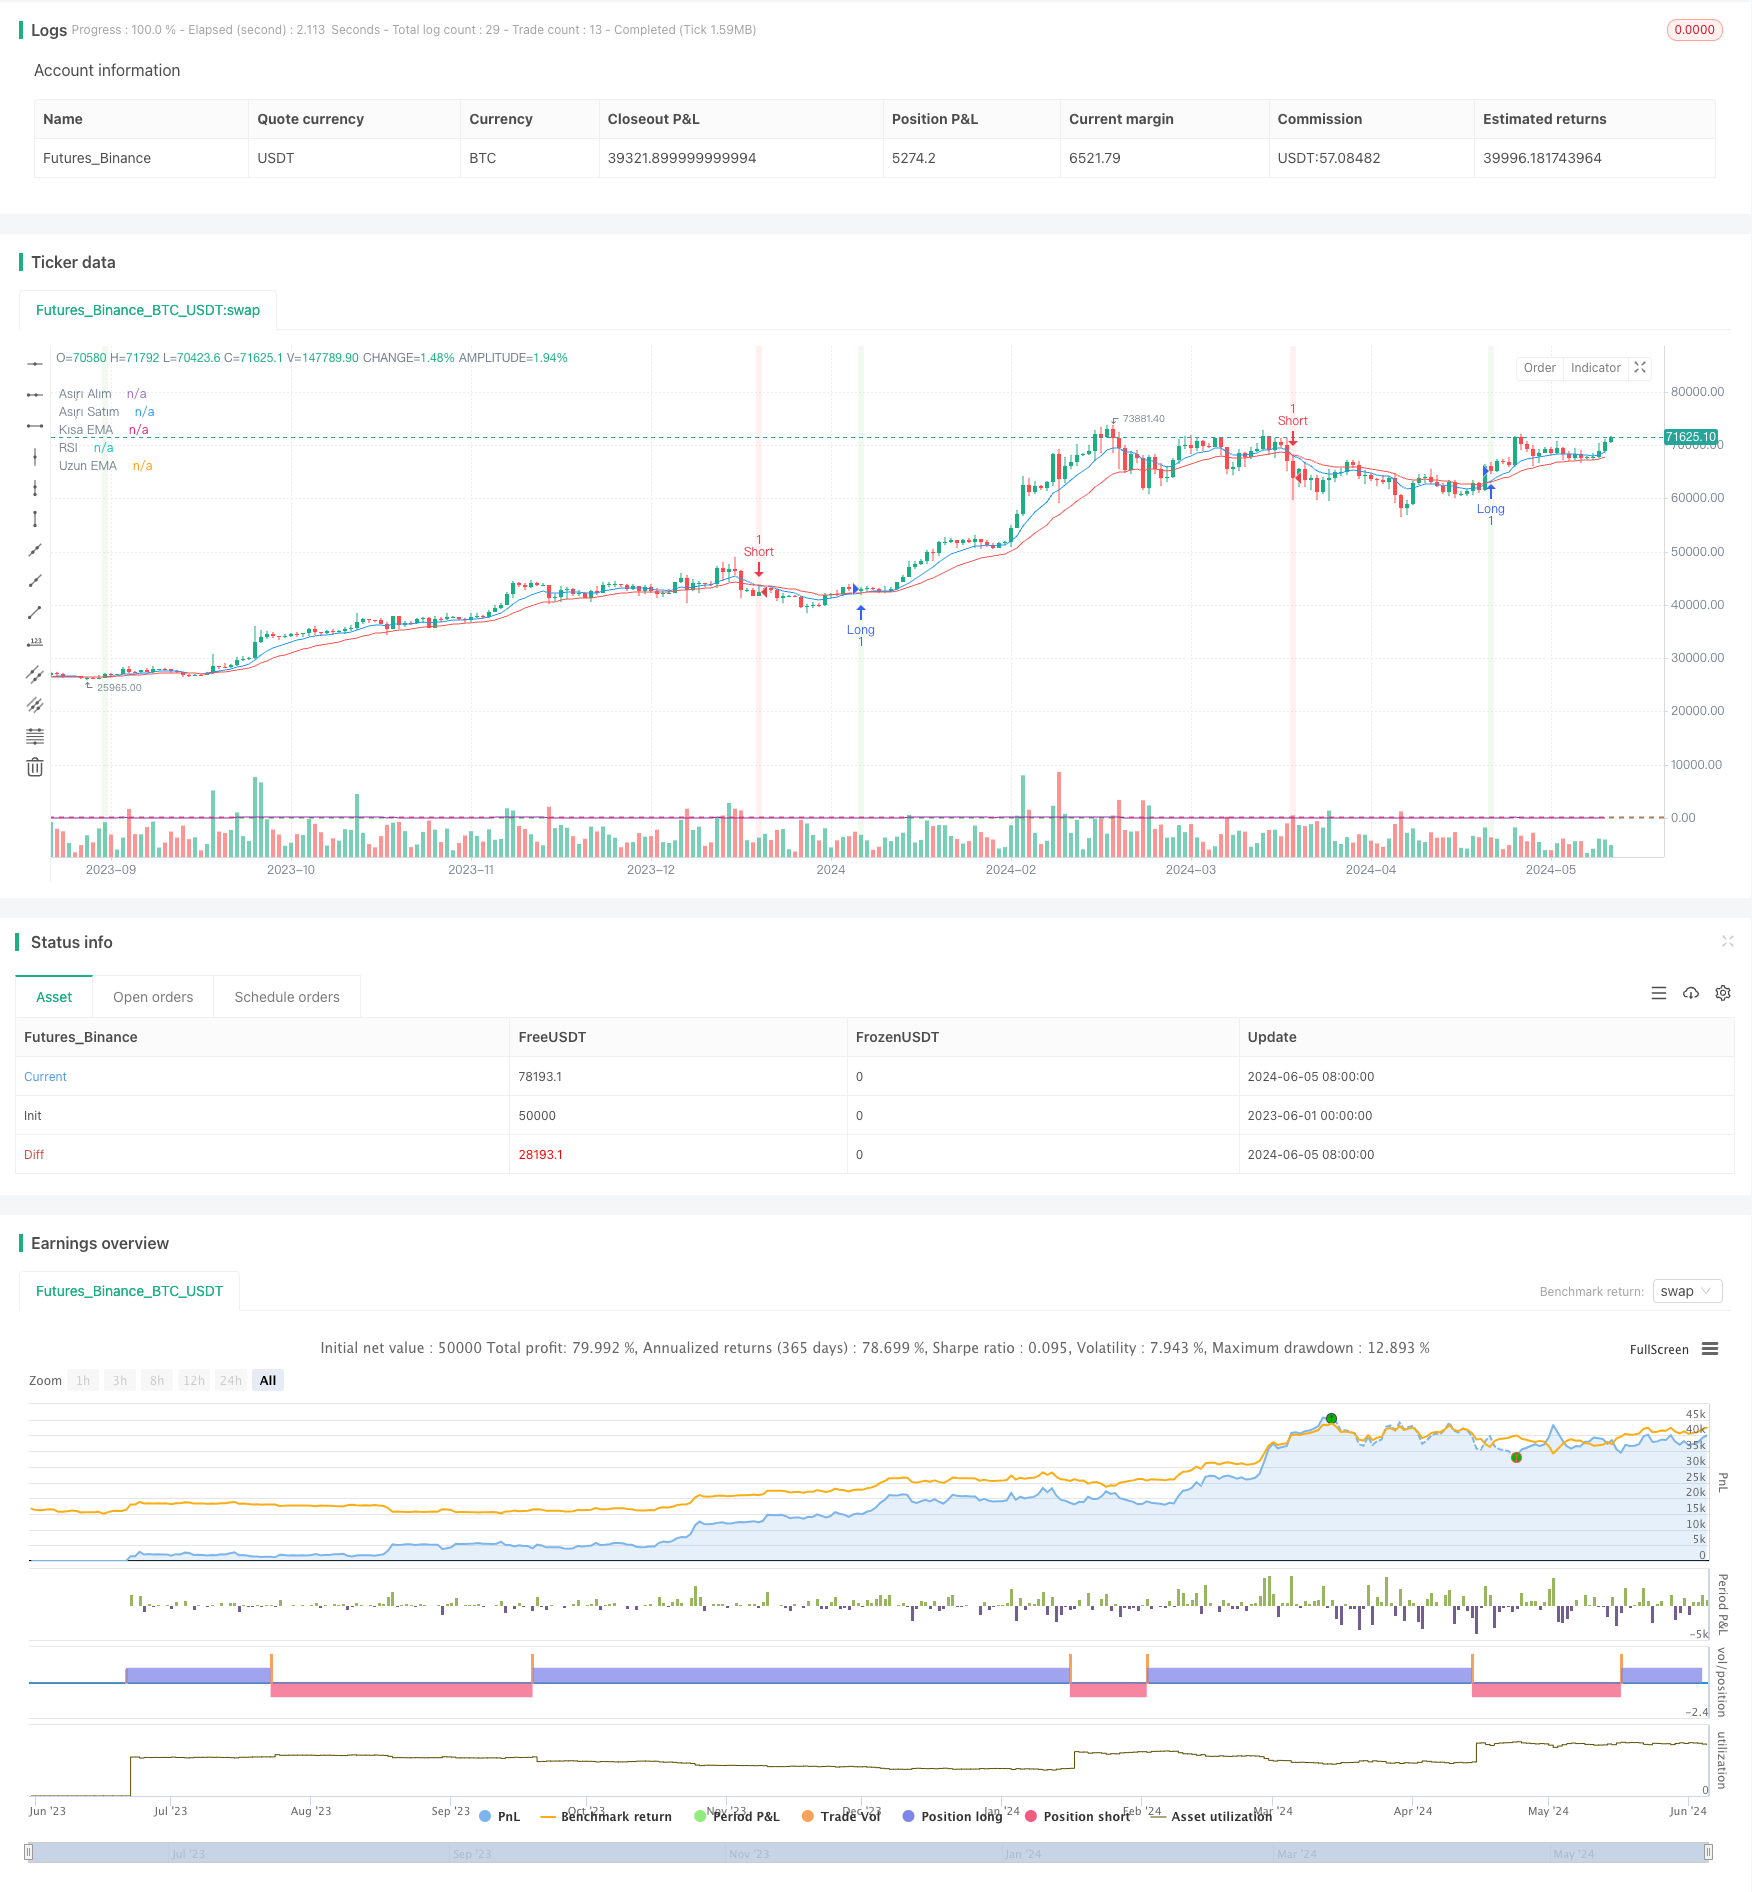
This strategy combines three technical indicators: EMA crossover, RSI, and MACD, to build a dual trend confirmation trading strategy. The strategy determines the trend direction using EMA crossover and uses RSI and MACD as filtering conditions to generate trading signals after the trend is confirmed. This strategy is suitable for tracking trending markets while avoiding early entry in oscillating markets.

Strategy Principles

  1. Calculate two EMAs with different periods. The short-term EMA reflects recent price changes, while the long-term EMA reflects the medium to long-term trend.
  2. Calculate the RSI indicator to determine overbought and oversold market conditions, avoiding entry in extreme situations.
  3. Calculate the MACD indicator. The crossover of the MACD line and the signal line can serve as a trend confirmation signal.
  4. Long entry condition: Short-term EMA crosses above the long-term EMA, RSI is not in the overbought area, and MACD line crosses above the signal line.
  5. Short entry condition: Short-term EMA crosses below the long-term EMA, RSI is not in the oversold area, and MACD line crosses below the signal line.
  6. Generate trading signals based on entry conditions and display the signals on the chart background.

Strategy Advantages

  1. Dual trend confirmation: EMA crossover determines the trend direction, while MACD crossover serves as trend confirmation, enhancing the reliability of the signals.
  2. RSI filtering: By using RSI to determine overbought and oversold conditions, the strategy avoids entry in extreme situations, reducing risk.
  3. Flexible parameters: Users can adjust the parameters of EMA, RSI, and MACD based on different market characteristics to optimize strategy performance.
  4. Clear and intuitive: The strategy logic is clear, and the chart background color provides intuitive hints for trading signals.

Strategy Risks

  1. Parameter optimization: The optimal parameters may vary across different markets and time frames, requiring optimization based on actual situations.
  2. Oscillating markets: In oscillating markets, EMA and MACD crossovers may occur frequently, leading to excessive trading signals and increasing trading costs.
  3. Trend reversals: At trend reversal points, the strategy may generate false signals, resulting in losses.
  4. Risk management: The strategy does not include stop-loss and take-profit levels, requiring reasonable risk management measures based on actual situations.

Strategy Optimization Directions

  1. Incorporate trend filtering: Use indicators such as ATR and ADX to determine if the market is in a trending state, avoiding signals in oscillating markets.
  2. Optimize entry timing: Adjust the parameters of EMA, RSI, and MACD based on market characteristics to find the optimal entry points.
  3. Incorporate risk management: Set reasonable stop-loss and take-profit levels to control risk per trade.
  4. Combine with other indicators: Use indicators such as volume and volatility to enhance the reliability of the signals.

Summary

This strategy combines three indicators: EMA crossover, RSI, and MACD, to build a dual trend confirmation trading strategy. The strategy logic is clear, and the signals are intuitive, suitable for tracking trending markets. However, in practical application, attention should be paid to parameter optimization, risks in oscillating markets, and the identification of trend reversal points. By incorporating trend filtering, optimizing entry timing, setting risk management measures, and other enhancements, the stability and profitability of the strategy can be further improved.


/*backtest
start: 2023-06-01 00:00:00
end: 2024-06-06 00:00:00
period: 1d
basePeriod: 1h
exchanges: [{"eid":"Futures_Binance","currency":"BTC_USDT"}]
*/

//@version=5
strategy("15 Dakikalık Göstergelerle Strateji", shorttitle="15m Strat", overlay=true)

// Parametreler
short_ma_length = input.int(9, title="Kısa EMA")
long_ma_length = input.int(21, title="Uzun EMA")
rsi_length = input.int(14, title="RSI Periyodu")
rsi_overbought = input.int(70, title="RSI Aşırı Alım")
rsi_oversold = input.int(30, title="RSI Aşırı Satım")

// EMA Hesaplamaları
short_ema = ta.ema(close, short_ma_length)
long_ema = ta.ema(close, long_ma_length)

// RSI Hesaplaması
rsi = ta.rsi(close, rsi_length)

// MACD Hesaplaması
[macdLine, signalLine, _] = ta.macd(close, 12, 26, 9)

// Göstergeleri Grafiğe Çizme
plot(short_ema, title="Kısa EMA", color=color.blue)
plot(long_ema, title="Uzun EMA", color=color.red)
hline(rsi_overbought, "Aşırı Alım", color=color.red)
hline(rsi_oversold, "Aşırı Satım", color=color.green)
plot(rsi, title="RSI", color=color.purple)

// İşlem Koşulları
longCondition = ta.crossover(short_ema, long_ema) and rsi < rsi_overbought and macdLine > signalLine
if (longCondition)
    strategy.entry("Long", strategy.long)

shortCondition = ta.crossunder(short_ema, long_ema) and rsi > rsi_oversold and macdLine < signalLine
if (shortCondition)
    strategy.entry("Short", strategy.short)

// Grafik Arkaplanı İşlem Koşullarına Göre Değiştirme
bgcolor(longCondition ? color.new(color.green, 90) : na, title="Long Signal Background")
bgcolor(shortCondition ? color.new(color.red, 90) : na, title="Short Signal Background")

template: strategy.tpl:40:21: executing "strategy.tpl" at <.api.GetStrategyListByName>: wrong number of args for GetStrategyListByName: want 7 got 6