RSI Dynamic Drawdown Stop-Loss Strategy

Overview
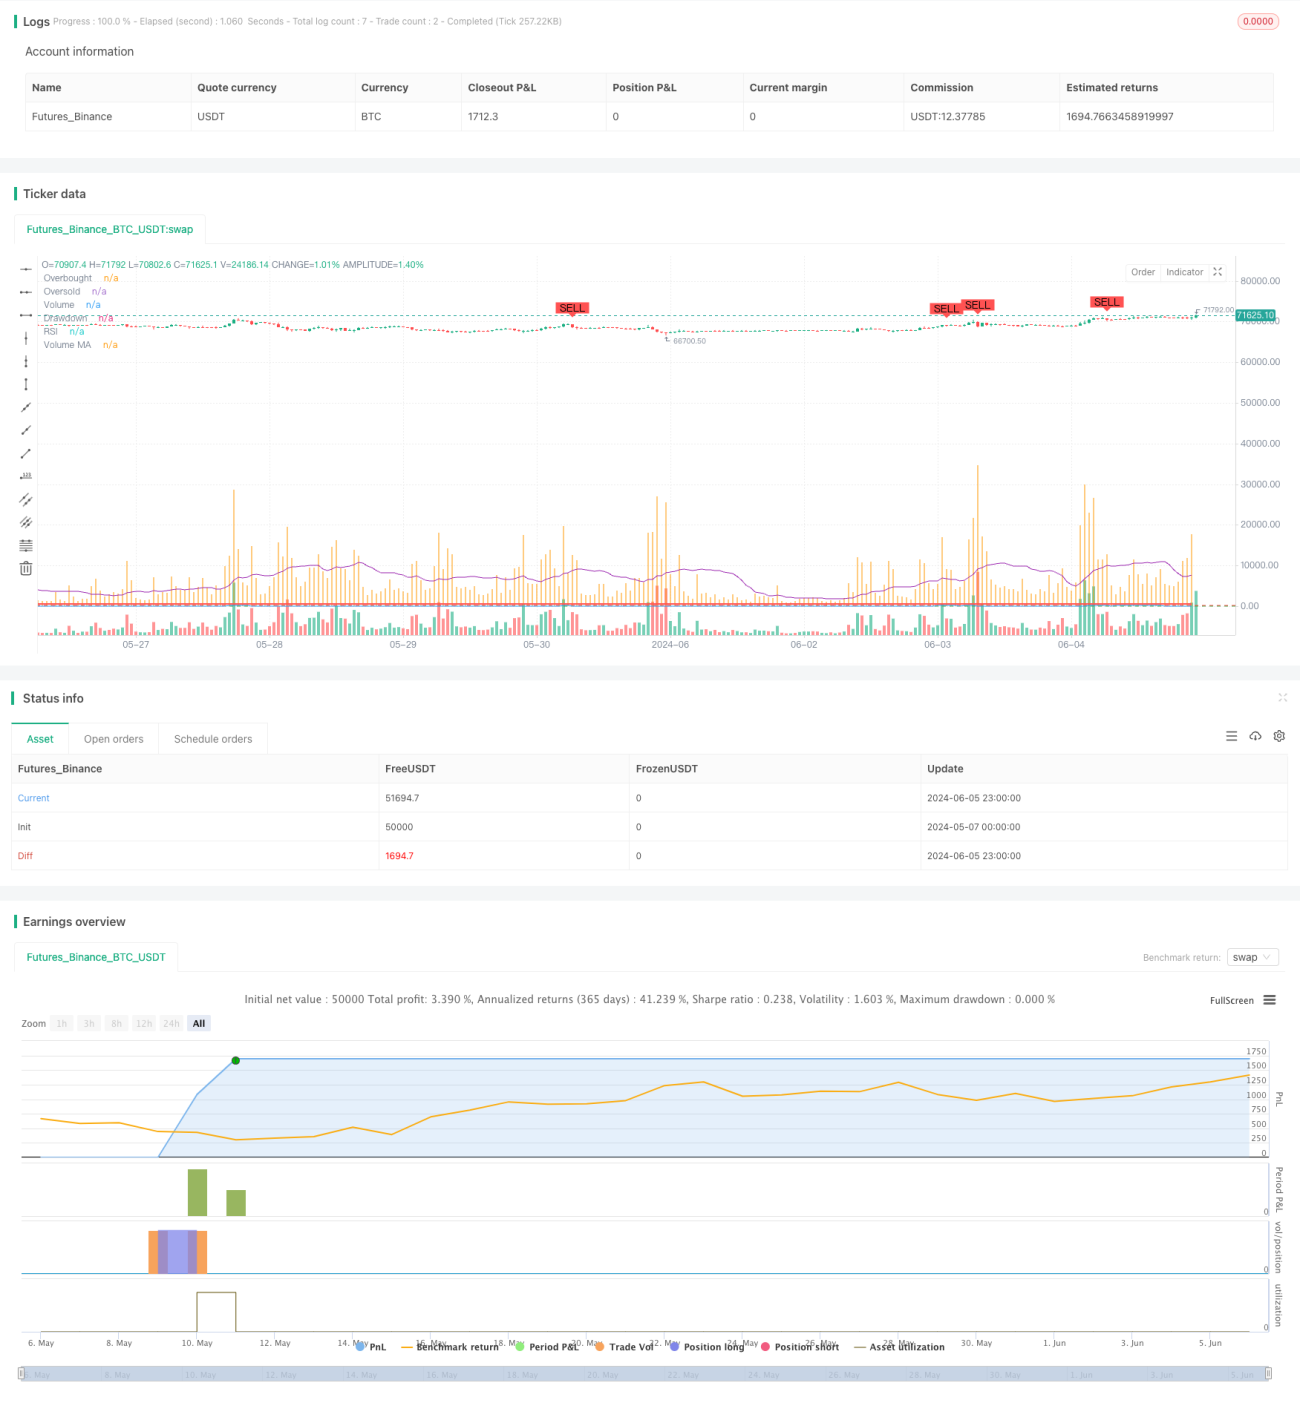
This strategy is based on the Wyckoff Methodology, combining the Relative Strength Index (RSI) and Volume Moving Average (Volume MA) to identify the accumulation and distribution phases of the market, generating buy and sell signals. Additionally, the strategy employs a dynamic drawdown stop-loss mechanism to control risk by setting a maximum drawdown threshold.
Strategy Principle
- Calculate the RSI indicator and Volume Moving Average.
- When the RSI crosses above the oversold area and the volume is greater than the Volume MA, it identifies the market's accumulation phase and generates a buy signal.
- When the RSI crosses below the overbought area and the volume is greater than the Volume MA, it identifies the market's distribution phase and generates a sell signal.
- The strategy simultaneously tracks the account's maximum equity and current drawdown. If the current drawdown exceeds the set maximum drawdown threshold, the strategy closes all positions.
- Buy positions are closed during the distribution phase or when the drawdown exceeds the maximum drawdown, while sell positions are closed during the accumulation phase or when the drawdown exceeds the maximum drawdown.
Strategy Advantages
- By combining RSI and volume indicators, the strategy can more accurately capture the accumulation and distribution phases of the market.
- The dynamic drawdown stop-loss mechanism effectively controls the strategy's maximum drawdown, reducing overall strategy risk.
- Suitable for 5-minute high-frequency data, allowing quick response to market changes and timely position adjustments.
Strategy Risks
- RSI and volume indicators may generate misleading signals under certain market conditions, leading to incorrect trading decisions by the strategy.
- The setting of the maximum drawdown threshold needs to be adjusted according to market characteristics and personal risk preferences; improper settings may lead to premature position closing or excessive risk-taking.
- The strategy may generate frequent trading signals in choppy markets, increasing trading costs.
Strategy Optimization Directions
- Consider introducing other technical indicators such as MACD, Bollinger Bands, etc., to improve the accuracy of the strategy's signals.
- Optimize the parameters of the RSI and volume indicators, such as adjusting the length of the RSI, overbought/oversold thresholds, etc., to adapt to different market conditions.
- In addition to drawdown stop-loss, incorporate trailing stop-loss or profit protection mechanisms to further control risk and lock in profits.
Summary
The RSI Dynamic Drawdown Stop-Loss Strategy identifies the accumulation and distribution phases of the market by combining RSI and volume indicators while employing a dynamic drawdown stop-loss mechanism to control risk. The strategy considers both market trend and risk management, making it practical to some extent. However, the strategy's performance depends on the choice of indicator parameters and market characteristics, requiring continuous optimization and adjustment to improve its stability and profitability.
- 1