EMA Dual Moving Average Crossover Strategy

Overview
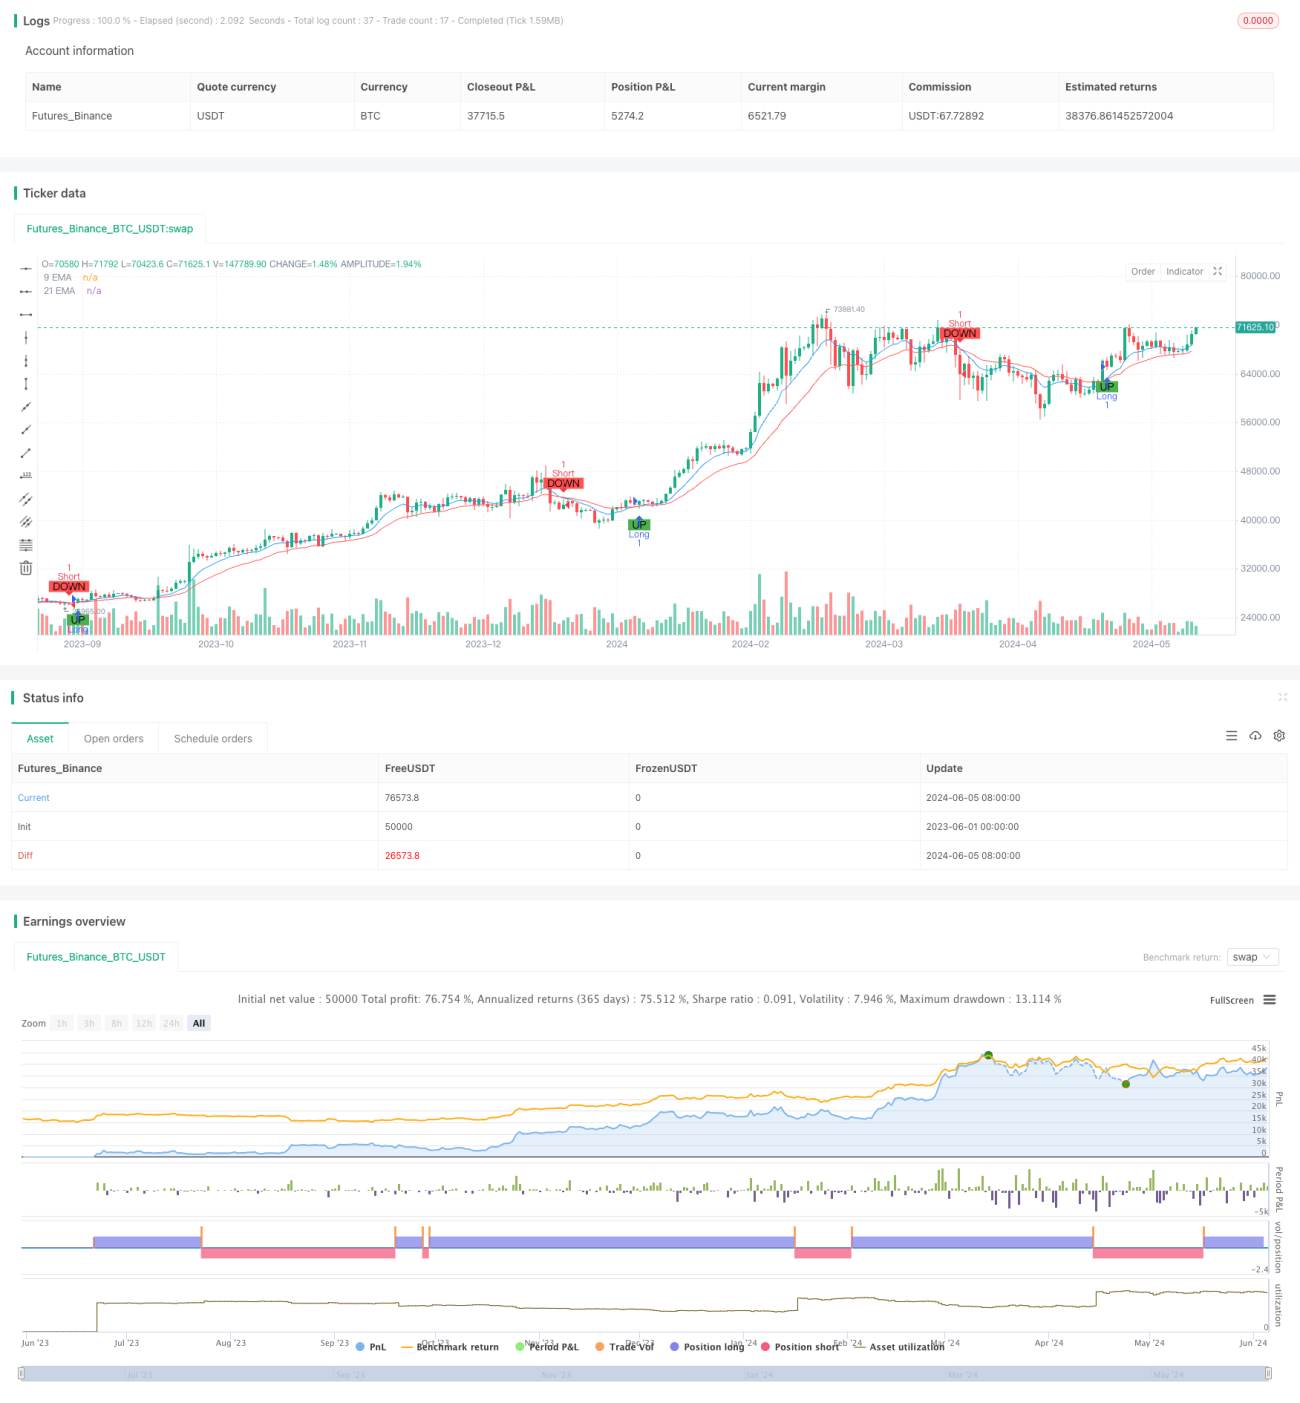
This strategy uses two exponential moving averages (EMAs) to capture changes in price trends. When the short-term EMA crosses above the long-term EMA from below, a buy signal is generated; when the short-term EMA crosses below the long-term EMA from above, a sell signal is generated. The strategy also sets daily stop-loss and take-profit limits to control single-day losses and profits.
Strategy Principles
- Calculate the short-term EMA (default period of 9) and long-term EMA (default period of 21).
- When the short-term EMA crosses above the long-term EMA, open a long position; when the short-term EMA crosses below the long-term EMA, open a short position.
- Record the account equity at the start of each trading day and calculate the difference between the current account equity and the starting equity, i.e., the daily profit and loss.
- If the daily loss exceeds the maximum allowed loss (0.25% of the initial account funds), close all positions.
- If the daily profit exceeds the maximum allowed profit (2% of the initial account funds), close all positions.
Strategy Advantages
- Simple and easy to understand: The strategy logic is clear and uses only two moving averages to generate trading signals, making it easy to understand and implement.
- Trend following: By using the crossover of fast and slow EMAs, the strategy can capture changes in price trends relatively well, making it suitable for use in trending markets.
- Risk control: The daily stop-loss and take-profit limits can effectively control single-day losses and profits, preventing excessive fluctuations in the account.
Strategy Risks
- Parameter optimization: The performance of the strategy largely depends on the choice of EMA periods, and different parameter settings may lead to drastically different results. Therefore, parameter optimization and backtesting need to be performed in different market environments.
- Choppy markets: In choppy markets, prices frequently fluctuate above and below the EMAs, potentially generating many false signals and leading to frequent trades and capital erosion.
- Trend reversals: When market trends reverse, the strategy may delay entry or exit, missing the best trading opportunities.
Strategy Optimization Directions
- Introduce other technical indicators such as RSI and MACD to help judge trend strength and direction and improve signal accuracy.
- Optimize stop-loss and take-profit rules, such as using trailing stops or dynamic take-profit levels, to better protect profits and control risks.
- Dynamically adjust EMA periods based on market volatility to adapt to different market states.
- Combine fundamental analysis, such as economic data and major events, to filter and confirm trading signals.
Summary
The EMA dual moving average crossover strategy is a simple, easy-to-understand trading strategy suitable for trending markets. By using the crossover of fast and slow moving averages, it can capture changes in price trends relatively well. At the same time, the daily stop-loss and take-profit settings can effectively control risks. However, the strategy may underperform in choppy markets or during trend reversals and needs to be optimized and improved by combining other technical indicators and analysis methods.
- 1