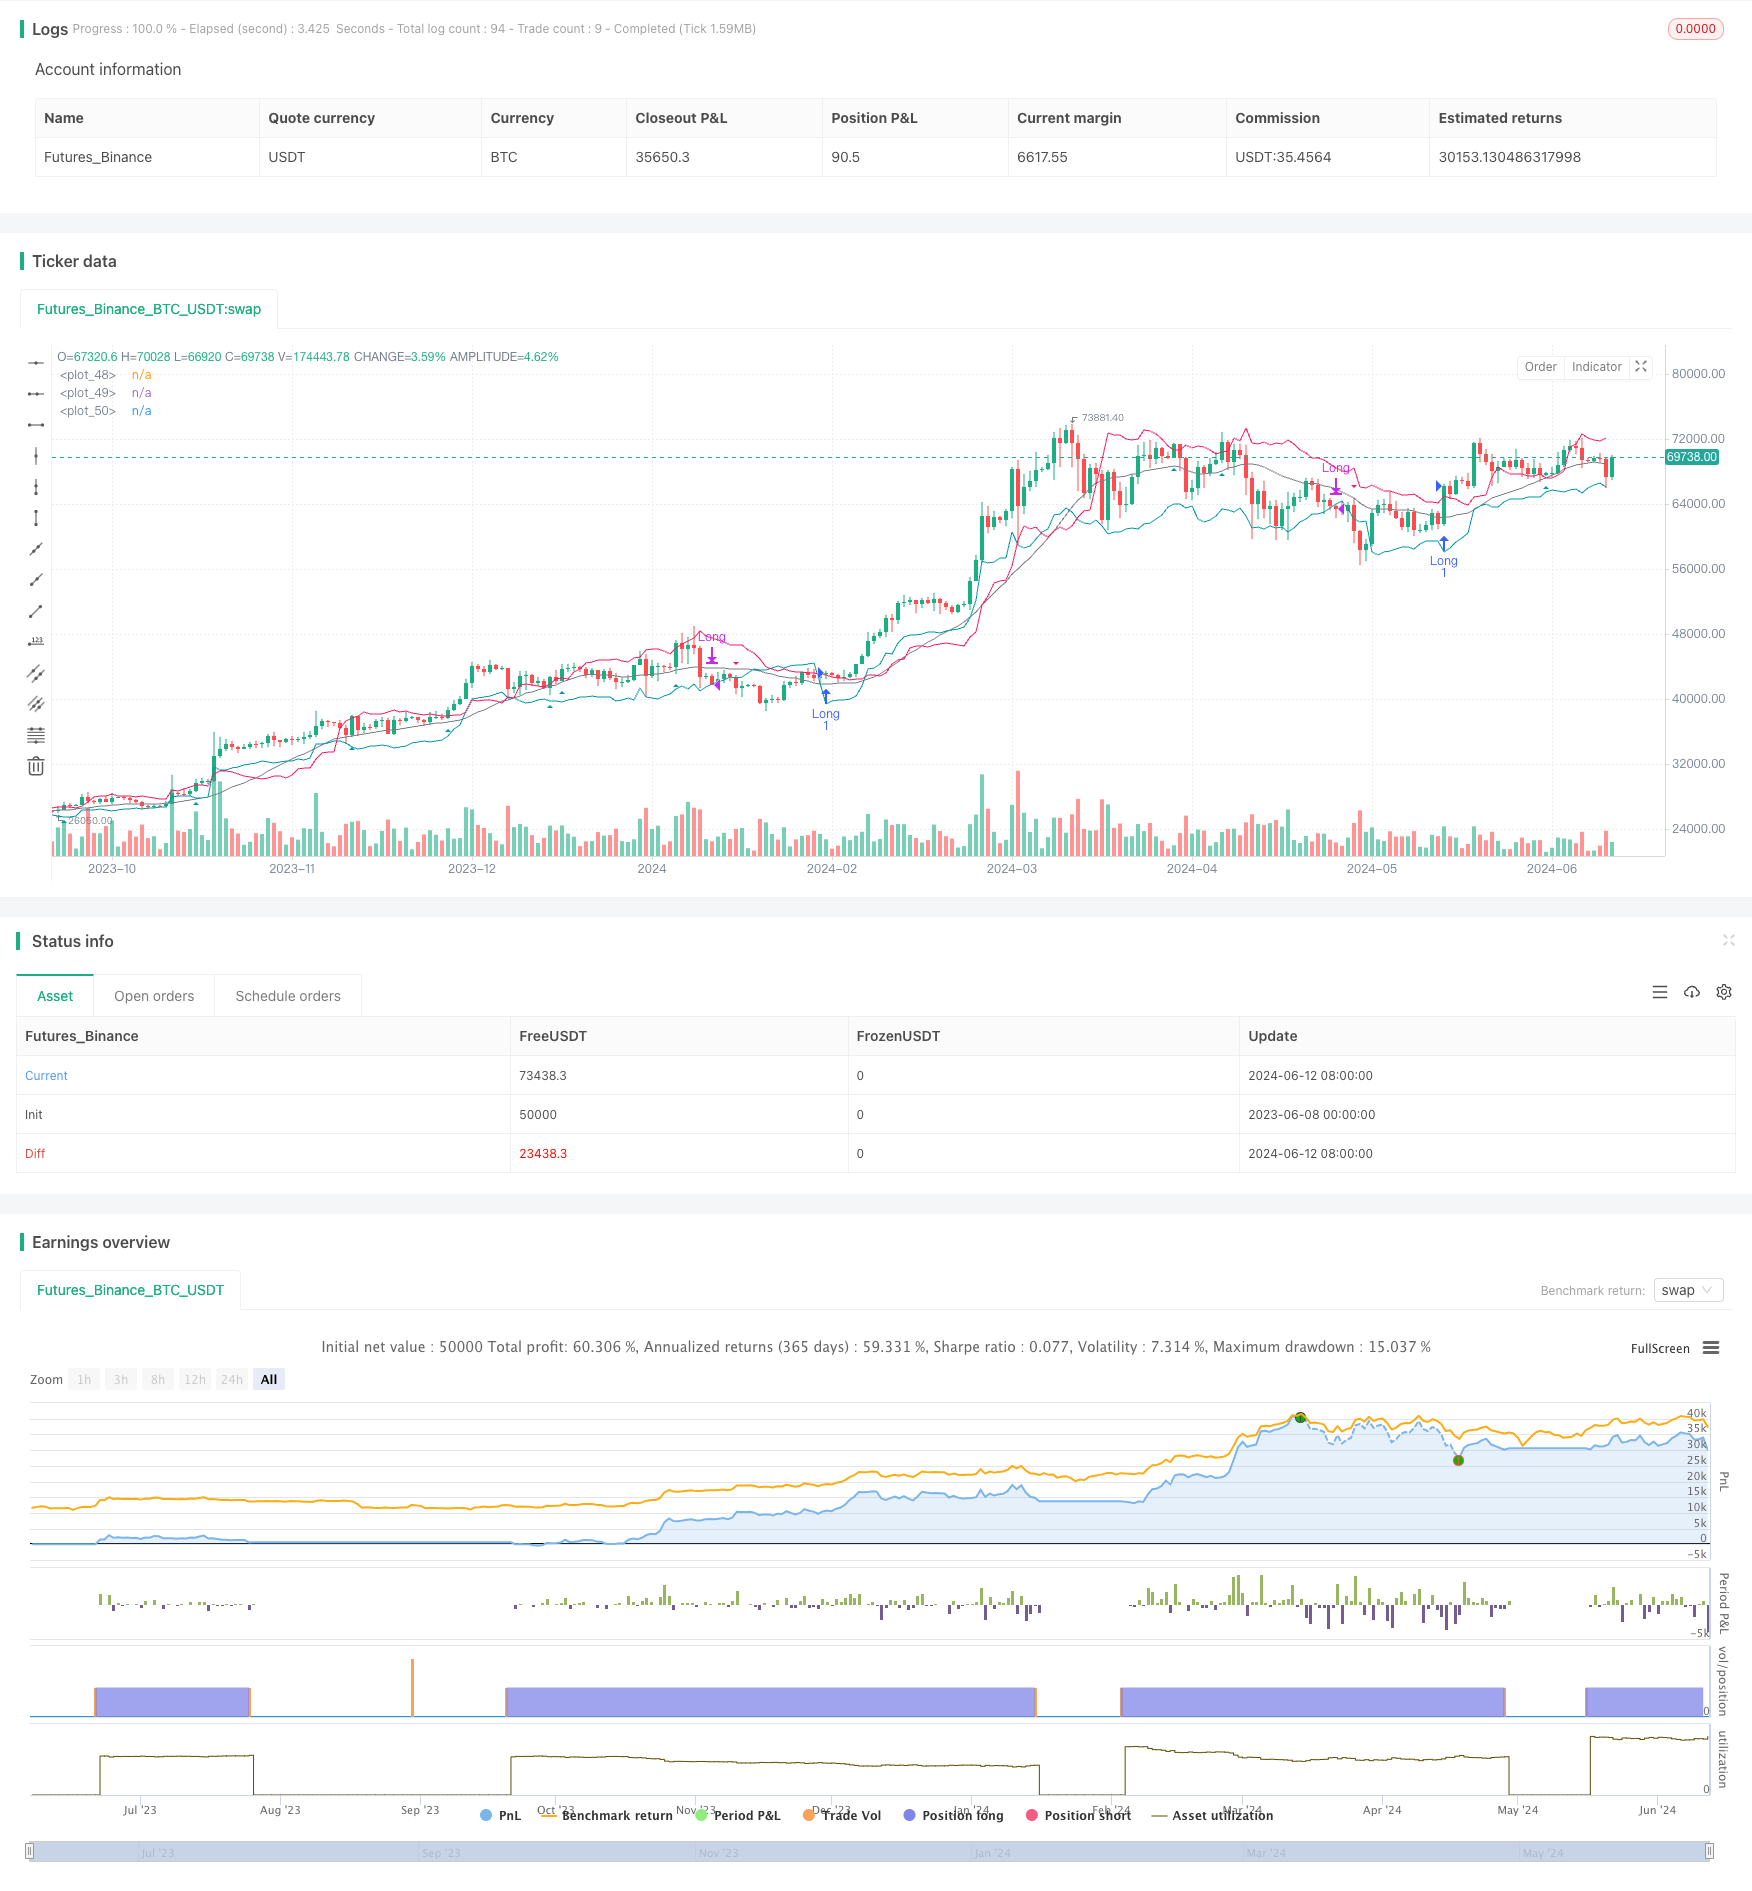
概述
Chande-Kroll止损动态ATR趋势跟踪策略是一个基于Chande-Kroll止损指标和简单移动平均线(SMA)的量化交易策略。该策略旨在捕捉市场的上涨趋势,同时使用动态止损来管理风险。Chande-Kroll止损指标根据平均真实波幅(ATR)动态调整止损水平,以适应不同的市场波动情况。21周期SMA用作趋势过滤器,确保在主要趋势方向上进行交易。
策略原理
该策略的核心是Chande-Kroll止损指标,它使用ATR来计算动态止损水平。ATR衡量市场波动性,止损水平根据ATR和乘数动态调整。这确保了止损位置能够适应当前的市场条件。同时,21周期SMA作为趋势过滤器,只有当收盘价高于SMA时,才会触发做多信号。这有助于避免在熊市中进行交易。 做多条件:当收盘价突破Chande-Kroll下轨且高于21周期SMA时,开始做多。 平仓条件:当收盘价跌破Chande-Kroll上轨时,平仓。
策略优势
- 动态止损:Chande-Kroll止损指标基于ATR计算动态止损水平,能够适应不同的市场波动情况,提高止损的有效性。
- 趋势跟踪:21周期SMA作为趋势过滤器,确保交易顺应主要趋势方向,降低逆势交易的风险。
- 参数灵活性:策略参数如ATR周期、ATR乘数、止损周期和SMA周期等都可以根据用户偏好进行调整,提高策略的适应性。
- 头寸规模管理:头寸规模根据风险乘数和当前市场波动情况动态调整,实现风险的动态管理。
策略风险
- 参数优化风险:策略参数需要根据不同的市场状况和交易品种进行优化,不恰当的参数设置可能导致策略表现不佳。
- 趋势识别风险:在震荡市或趋势反转初期,策略可能会产生错误信号,导致亏损。
- 滑点和交易成本:实际交易中,滑点和交易成本会影响策略的净收益。 风险管理措施包括:对策略进行全面的回测和参数优化;在实际交易中,严格遵循策略规则,控制每笔交易的风险;定期评估策略表现,必要时进行调整。
策略优化方向
- 多空双向交易:目前策略只有做多信号,可以扩展为多空双向交易,以充分捕捉不同市场环境下的机会。
- 动态参数优化:使用机器学习或优化算法,根据市场状况实时调整策略参数,提高适应性。
- 组合其他技术指标:引入其他趋势类或震荡类指标,构建多因子策略,提高信号的可靠性。
- 加入市场情绪指标:结合市场情绪指标如VIX等,在市场极端情绪时控制交易,提高风险管理能力。
总结
Chande-Kroll止损动态ATR趋势跟踪策略是一个基于动态止损和趋势跟踪原理的量化交易策略。通过Chande-Kroll止损指标和SMA趋势过滤器的结合,该策略能够在捕捉上涨趋势的同时,有效管理风险。策略参数的灵活性以及头寸规模的动态调整,进一步增强了策略的适应性。尽管策略存在一定的风险,但通过合理的风险管理措施以及持续的优化改进,该策略有望实现长期稳定的收益。
策略源码
/*backtest
start: 2023-06-08 00:00:00
end: 2024-06-13 00:00:00
period: 1d
basePeriod: 1h
exchanges: [{"eid":"Futures_Binance","currency":"BTC_USDT"}]
*/

//@version=5
strategy("Chande Kroll Stop Strategy", overlay=true, initial_capital = 1000, commission_type = strategy.commission.percent, commission_value = 0.01, slippage = 3)

// Chande Kroll Stop parameters
calcMode = input.string(title="Calculation Mode", defval="Exponential", options=["Linear", "Exponential"])
riskMultiplier = input(5, "Risk Multiplier")
atrPeriod = input(10, "ATR Period")
atrMultiplier = input(3, "ATR Multiplier")
stopLength = input(21, "Stop Length")
smaLength = input(21, "SMA Length")

// Calculate ATR
atr = ta.atr(atrPeriod)

// Calculate Chande Kroll Stop
highStop = ta.highest(high, stopLength) - atrMultiplier * atr
lowStop = ta.lowest(low, stopLength) + atrMultiplier * atr

sma21 = ta.sma(close, smaLength)

// Entry and Exit conditions
longCondition = ta.crossover(close, lowStop) and close > sma21
exitLongCondition = close < highStop

// Funktion zur Berechnung der Menge
calc_qty(mode, riskMultiplier) =>
    lowestClose = ta.lowest(close, 1560)
    if mode == "Exponential"
        qty = riskMultiplier / lowestClose * 1000 * strategy.equity / strategy.initial_capital
    else
        qty = riskMultiplier / lowestClose * 1000

// Berechnung der Menge basierend auf der Benutzerwahl
qty = calc_qty(calcMode, riskMultiplier)

// Execute strategy
if (longCondition)
    strategy.entry("Long", strategy.long, qty=qty)
    alert("Buy Signal", alert.freq_once_per_bar_close)

if (exitLongCondition)
    strategy.close("Long")
    alert("Sell Signal", alert.freq_once_per_bar_close)

// Plotting
plotshape(series=longCondition, location=location.belowbar, color=#0097a7, style=shape.triangleup, size=size.small, title="Buy Signal")
plotshape(series=ta.crossunder(close, highStop), location=location.abovebar, color=#ff195f, style=shape.triangledown, size=size.small, title="Sell Signal")
plot(sma21, color=color.gray)
plot(highStop, color=#0097a7)
plot(lowStop, color=#ff195f)
相关推荐