RSI Trend Strategy

Overview
This strategy is based on the Relative Strength Index (RSI) indicator. It determines buy and sell signals by judging whether the RSI value exceeds preset upper and lower thresholds. Additionally, the strategy sets stop-loss and position duration limits to control risk.
Strategy Principle
- Calculate the value of the RSI indicator.
- When the RSI value is below the preset buy threshold, generate a buy signal; when the RSI value is above the preset sell threshold, generate a sell signal.
- Based on the buy signal, calculate the buy quantity at the current closing price and place a buy order.
- If a stop-loss percentage is set, calculate the stop-loss price and place a stop-loss order.
- Close all positions based on the sell signal or stop-loss condition.
- If a maximum position duration is set, close all positions after the position duration exceeds the maximum, regardless of profit or loss.
Strategy Advantages
- The RSI indicator is a widely used technical analysis indicator that can effectively capture overbought and oversold signals in the market.
- The strategy incorporates stop-loss and position duration limits, which help control risk.
- The strategy logic is clear and easy to understand and implement.
- By adjusting the parameters and thresholds of the RSI, the strategy can adapt to different market environments.
Strategy Risks
- In some cases, the RSI indicator may generate false signals, leading to losses in the strategy.
- The strategy does not consider the fundamental factors of the trading instrument and relies solely on technical indicators, which may face risks from unexpected market events.
- Fixed stop-loss percentages may not adapt to changes in market volatility.
- The performance of the strategy may be affected by parameter settings, and inappropriate parameters may lead to poor strategy performance.
Strategy Optimization Directions
- Introduce other technical indicators, such as moving averages, to improve the reliability of the strategy.
- Optimize the stop-loss strategy, such as using trailing stop-loss or dynamic stop-loss based on volatility.
- Dynamically adjust the parameters and thresholds of the RSI according to market conditions.
- Combine the analysis of the fundamental aspects of the trading instrument to improve the risk control ability of the strategy.
- Perform backtesting and parameter optimization on the strategy to find the optimal parameter combination.
Summary
This strategy utilizes the RSI indicator to capture overbought and oversold signals in the market while introducing stop-loss and position duration limits to control risk. The strategy logic is simple and straightforward, easy to implement and optimize. However, the performance of the strategy may be affected by market volatility and parameter settings. Therefore, it is necessary to combine other analysis methods and risk management measures to improve the robustness and profitability of the strategy.
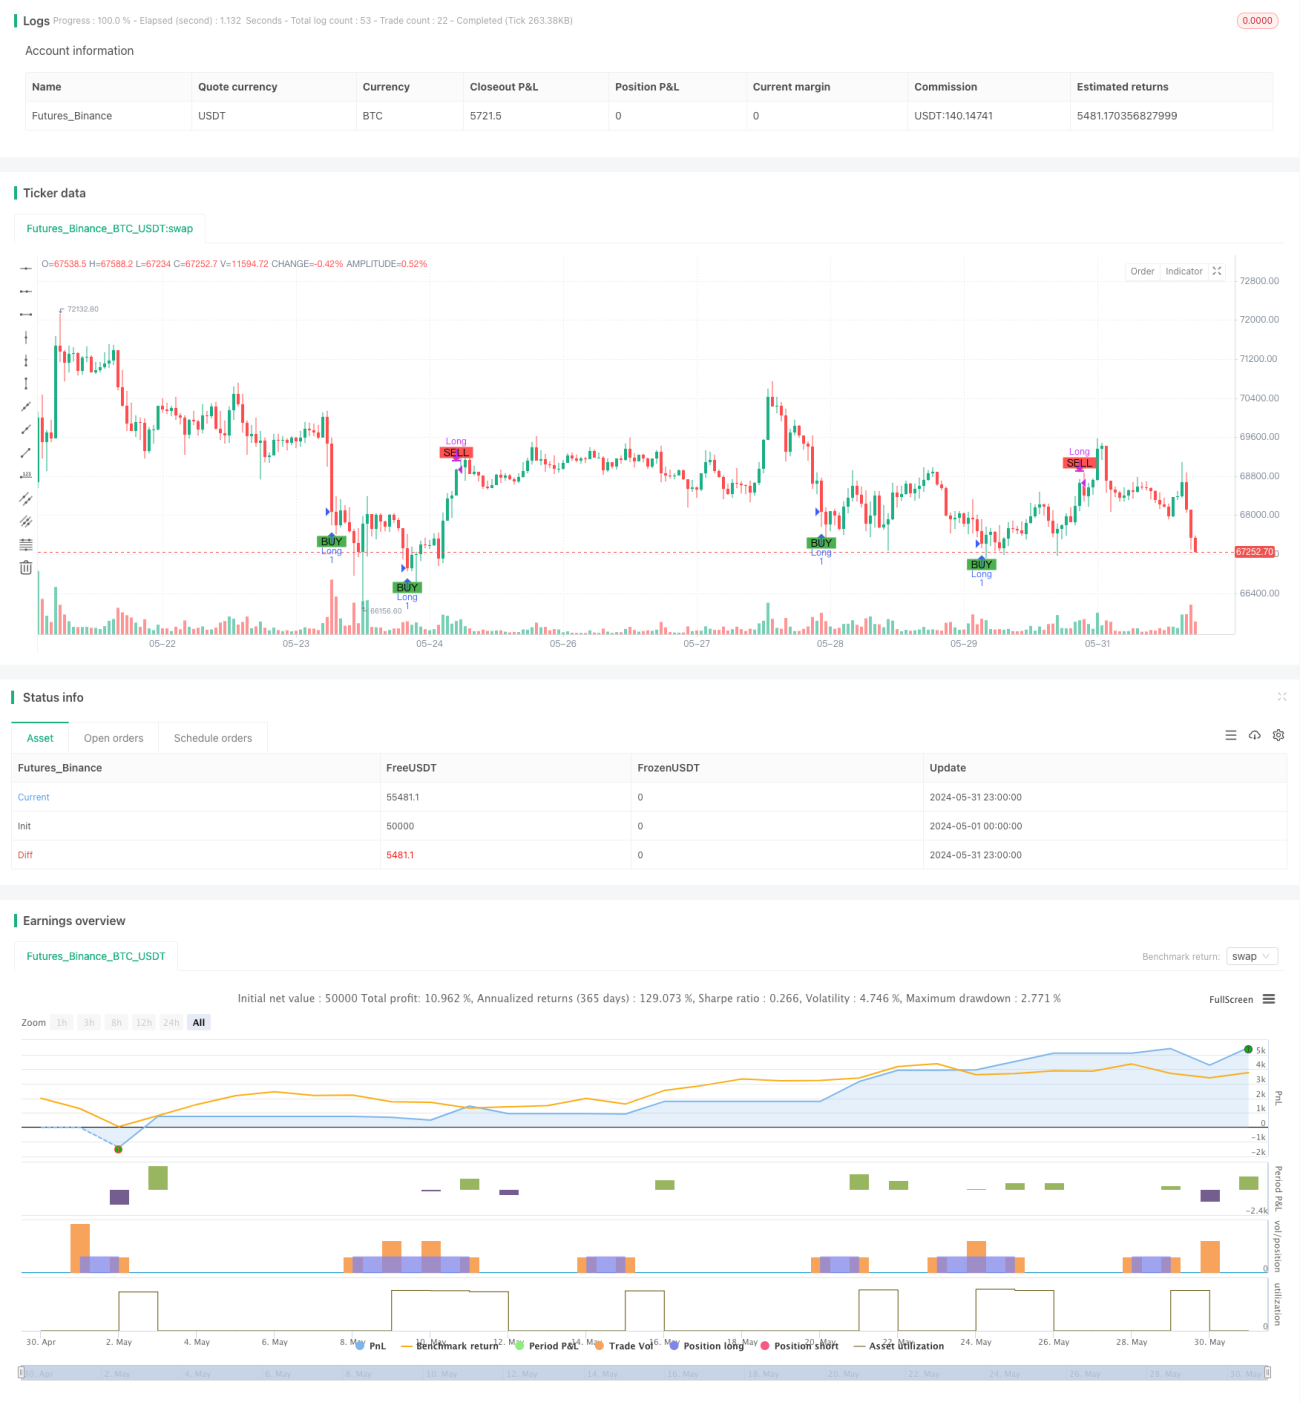
/*backtest
start: 2024-05-01 00:00:00
end: 2024-05-31 23:59:59
period: 1h
basePeriod: 15m
exchanges: [{"eid":"Futures_Binance","currency":"BTC_USDT"}]
*/

//@version=5
strategy("Simple RSI Strategy", overlay=true,  initial_capital=20, commission_value=0.1, commission_type=strategy.commission.percent)

// Define the hardcoded date (Year, Month, Day, Hour, Minute)- 1