Advanced Entry Strategy based on Moving Average, Support/Resistance, and Volume

Overview
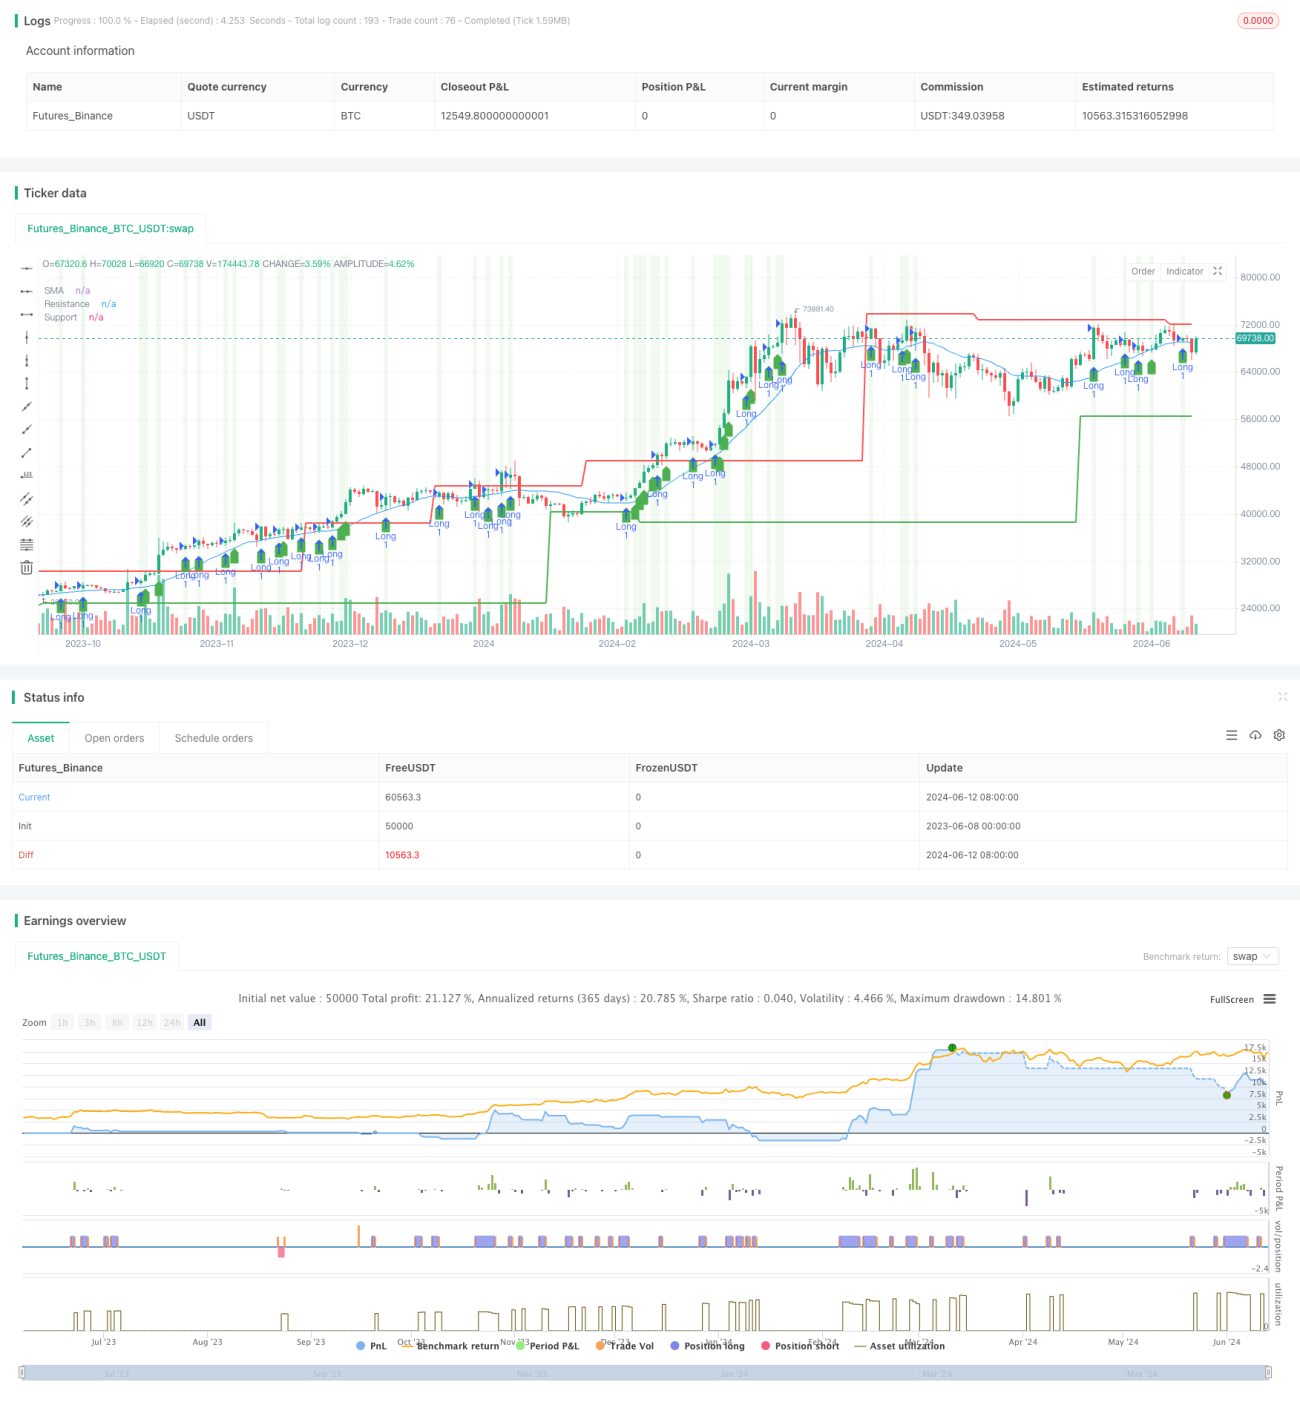
This strategy combines three technical indicators: Simple Moving Average (SMA), support and resistance levels, and increased trading volume to construct a comprehensive trading strategy. The main idea of the strategy is to enter trades when the price breaks through the SMA, support/resistance levels, and is accompanied by an increase in trading volume, while setting stop-loss conditions to control risk.
Strategy Principle
- Calculate the SMA, support, and resistance levels for a specified period.
- Determine if the current trading volume has increased compared to the previous period.
- Long entry condition: The current closing price is greater than the previous period's closing price, greater than the SMA and support level, and the price is at a certain distance from the resistance level, accompanied by an increase in trading volume.
- Short entry condition: The current closing price is less than the previous period's closing price, less than the SMA and support level, and the price is at a certain distance from the resistance level, accompanied by an increase in trading volume.
- Stop-loss condition: The long stop-loss price is the entry price multiplied by (1 - stop-loss percentage), and the short stop-loss price is the entry price multiplied by (1 + stop-loss percentage).
Advantage Analysis
- By combining multiple technical indicators, the strategy's reliability and stability are improved.
- Considering both price breakouts of the SMA and support/resistance levels allows for better capture of trending opportunities.
- Introducing the trading volume indicator ensures that price breakouts are accompanied by sufficient market participation, enhancing the effectiveness of the signals.
- Setting stop-loss conditions effectively controls trading risk.
Risk Analysis
- The calculation of support and resistance levels relies on historical data and may lose effectiveness during significant market fluctuations.
- The trading volume indicator may experience abnormal fluctuations, leading to false signals.
- The stop-loss condition setting may not completely avoid losses in extreme market situations.
Optimization Direction
- Consider introducing other technical indicators, such as the Relative Strength Index (RSI) or Moving Average Convergence Divergence (MACD), to further validate the reliability of trading signals.
- Optimize the calculation method for support and resistance levels, such as adopting a more dynamic approach to adapt to different market conditions.
- Smooth the trading volume indicator to reduce the impact of abnormal fluctuations on the strategy.
- Optimize the setting of stop-loss conditions, such as using a trailing stop-loss or dynamically adjusting the stop-loss percentage based on market volatility.
Summary
This strategy combines the SMA, support and resistance levels, and trading volume indicators to construct a comprehensive trading strategy. The strategy's advantage lies in its ability to capture trending opportunities while controlling trading risk. However, the strategy also has certain limitations, such as its adaptability to extreme market situations needs improvement. In the future, the strategy can be improved by introducing other technical indicators, optimizing the calculation method for support and resistance levels, smoothing the trading volume indicator, and optimizing stop-loss conditions to enhance its stability and profitability.
- 1